finished season  2015
finished season  2016
finished season  2017
finished season  2018
finished season  2019
finished season  2020
finished season  2021
finished season  2022
finished season  2023
Background
College basketball has among the largest home court advantages in all of sports.
Student sections have been getting increasingly creative in their attempts to affect the outcome of opposing team shooters making their free throws.
Previous Research
Duke medical student tabulated the miss percentage for games in the 2020-2021 and 2021-2022 seasons for various different distractions the graduate student section makes behind the basket in the second half.
Previous Research
Duke’s “Cameron Crazies”
Previous Research
Arizona State is known for its “curtain of distraction” which rose to fame in 2015 and even had a surprise distraction of shirtless olympian Michael Phelps.
Previous Research
The Harvard Sports Analytics Collective did a study in 2015 about the Arizona State “Curtain of Distraction”
Reported that visiting teams shot 60.6% from the free-throw line in the second half compared to 68.6% in the first half.
Estimated it was worth approximately 1.41 points per game.
Not a statistically significant
Previous Research
Harvard PhD student and author of the ncaahoopR package, Luke Benz revisited the Arizona State distraction in 2019 and found that there was not enough evidence to conclude that teams shoot worse against Arizona State than they do at other road games.
Data
Data from the 2015-2016 college basketball season until the current season’s data (2023-2024).
Home teams with less than 15 games in the dataset, grouped into one collective team.
Only look at true road games, not neutral site.
Data
Group all season’s together for the home team when assessing a fan base/court effect
But for the individual team shooting performances I treat each season separately
Methodology
Two methods I explore:
Second Half vs First Half (shooting into a rowdy student section)
Overall effect of a home court on free throw percentage
First Half vs Second
Not every team may put a large student section behind the second half visiting team’s basket
Want to assess if there is an effect for teams
Compare entire county to what we would expect due to randomness.
First Half vs Second
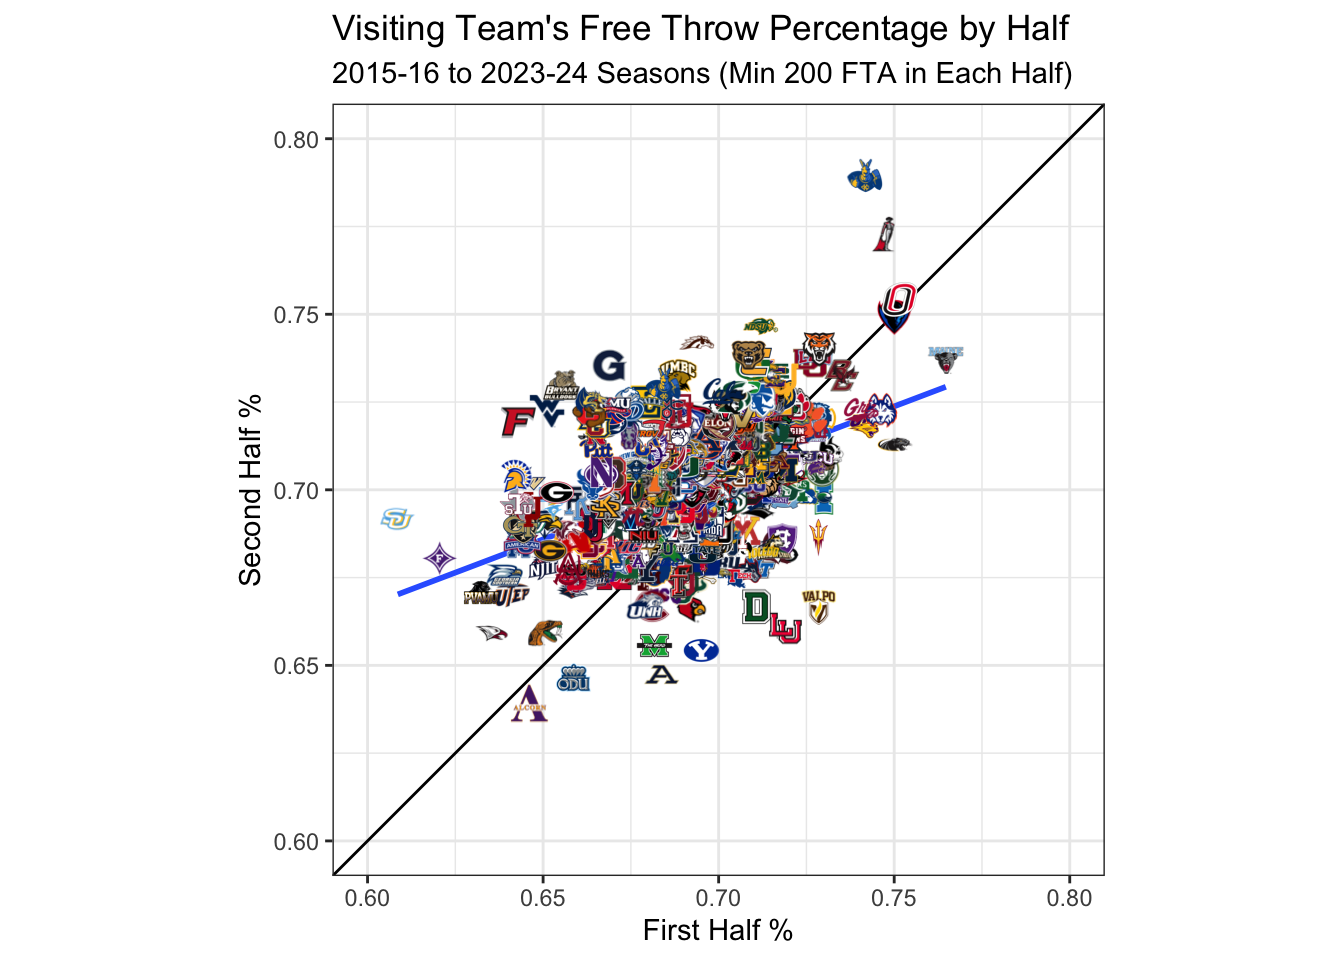
Only include teams with 200 free throws attempted at their home court in both the first half and second half in data set
Results of largest drop-off in free-throw percentage from the 1st half to the 2nd half
First Half vs Second
First Half vs Second
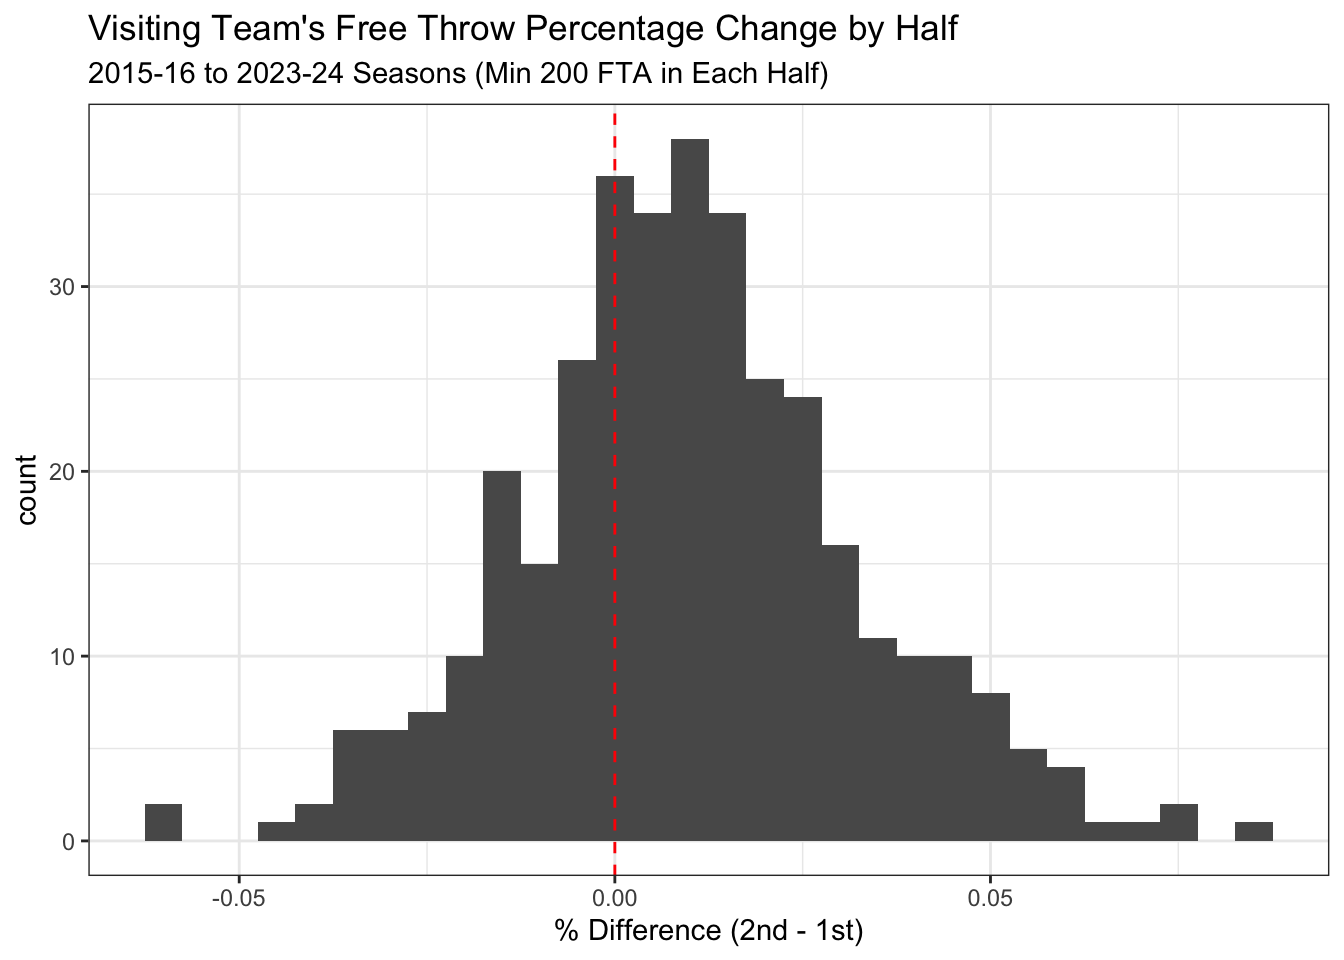
In fact, on average, visiting teams shoot 1 percent better in the second half than compared to the first.
Could be due to the effect of the end of game scenarios in basketball.
If a team is winning and getting fouled it does its best to get the ball into the hands of their best free throw shooters.
Hard to test this theory
Would need to go with free throw share by players conditional on time remaining and score.
I adjust p-values and z-scores by taking off an additional 1% of all 2nd half FT%
First Half vs Second
Visiting Free Throw % by Half
2015-16 to 2023-24 Seasons
First Half vs Second
Arizona State: “Curtain of Distraction”
BYU, has a wild student section behind the basket in the second half as well
BYU’s Student Section Attempting to Distract Opposing Shooter
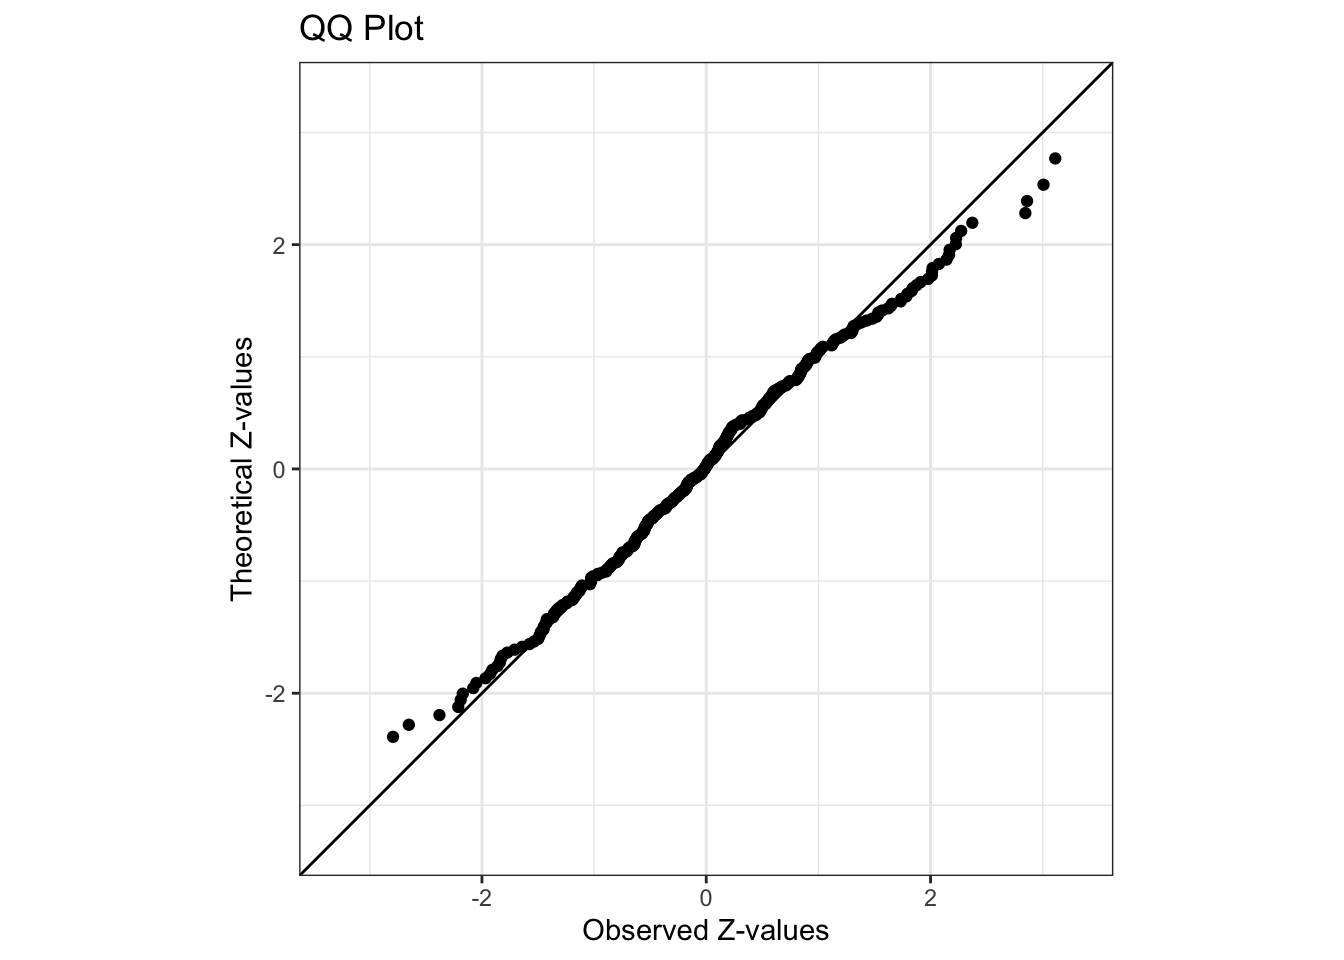
First Half vs Second - Chance?
Significance Test?
Multiple test corrections
Bonferroni: \(\frac{\alpha}{n}\)
\(n=355\) teams in our dataset, extremely high standard
First Half vs Second - Chance?
QQ Plot
Full Game Effect Model
College basketball has many teams in Division I with no stands behind the basket or no students.
Can analyze general specific home court effect on visiting team’s true ability in free-throw shooting percentage.
Full Game Effect Model
Samples sizes really are too small to do any player-level analysis
Stick to team-level analysis
A team’s FT % in road game minus average FT % in home games
Full Game Effect Model
What is a better comparison:
Free Throw Percentage at home games?
Free Throw Percentage at other raod games?
Full Game Effect Model
I used home games - More consistent data set (other road games have many different changing variables) - Power conference teams typically have may more home games than true road games.
Full Game Effect Model
This model doesn’t
Account for travel to higher elevations (my previous work at ESPN showed this to matter a lot)
Day’s rest for teams
Distance traveled
Individual player affects on FT% (assume this averages out over a season)
\(y_i\) is the difference the visiting team’s free throw percentage in game \(i\) and its free throw percentage in al their home games that season.
\(\gamma_j\) is the effect of the home team \(j\)’s
Weight the observations by the total number of free throw attempts in the game.
Results
Use posterior draws for the team effects to calculate the estimated effect a team’s home court has on the opposing team’s free throw percentage.
Calculate the posterior probability that a team’s home court has an effect that decreases the probability of an opponent making a free throw.
Results
Home Team's Venue Effect on Visiting Free Throws
Hierarchical Bayesian Model Using 2015-16 to 2023-24 Seasons
Results
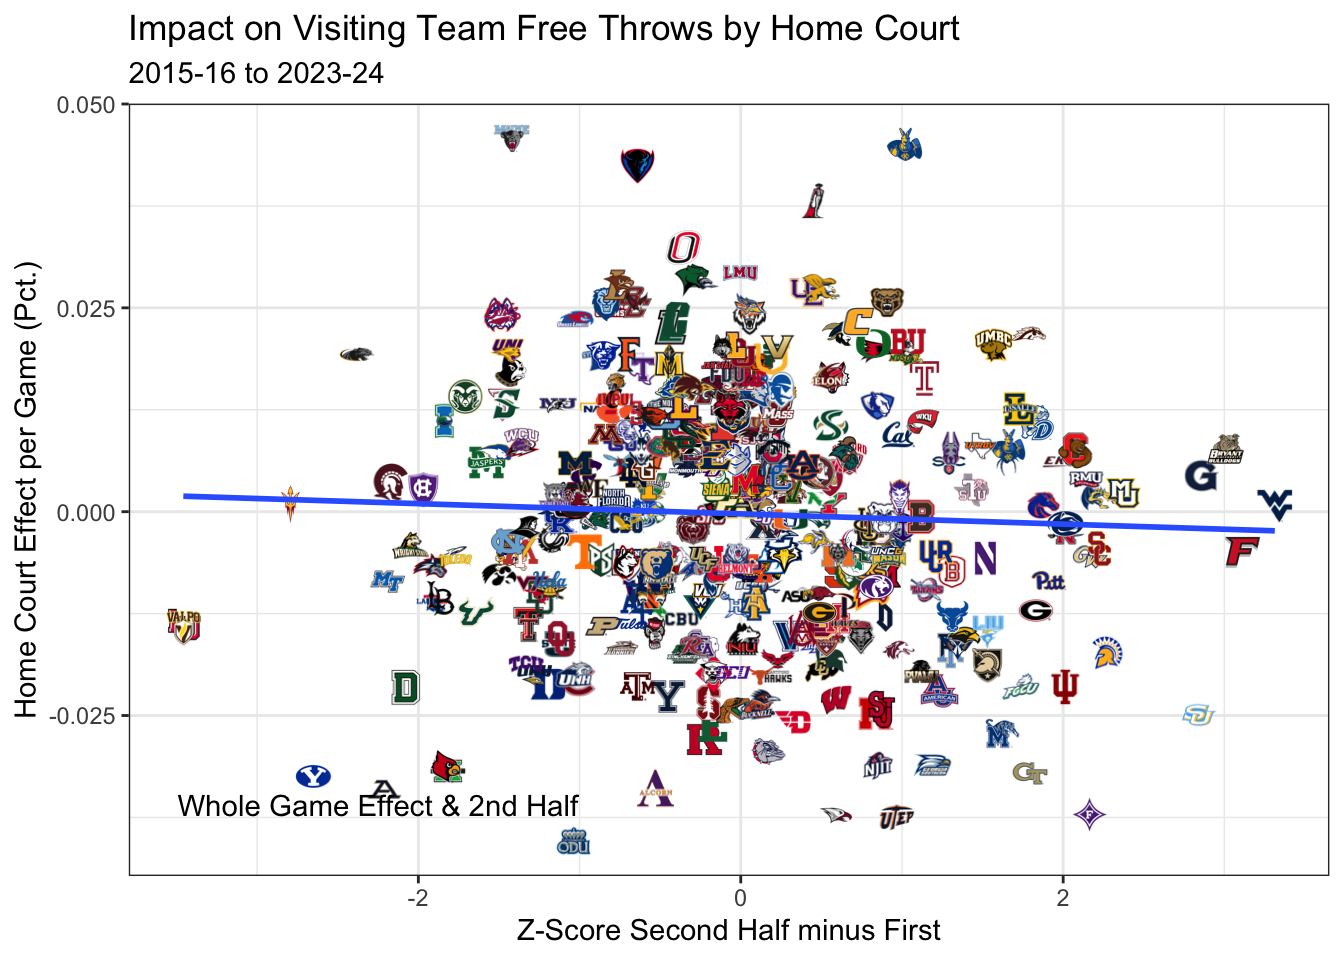
We can compare evidence of 2nd half effects to overall modeled affect of home crowd/court.
Results
Order of Magnitude for 2nd Half FTA:
Average FTA per game: 20.2303644.
Say average 2nd half FTA are 10
Impact per game in 2nd half is about: -1for the largest team effect.
Results
Order of Magnitude for whole game FT% Effect:
Average FTA per game: 20.2303644.
Impact per game is about: -2 for the largest team effect.
Conclusion
A handful of teams have clear evidence of a 2nd half effect
A handful of teams have clear evidence of teams shooting worse at FT’s in their stadium
Confounded with altitude, distanc traveled
Should get more teams to try 2nd half distractions!
Source Code
---title: "Can Students Affect Free Throws?"author: "Paul Sabin"revealjs: theme: beigeeditor: visualexecute: echo: false warning: false error: false message: false cache: true---```{r}library(parallel)library(tidyverse)library(hoopR)library(ggridges)library(gt)library(gtExtras)library(viridis)library(rstan)library(tidybayes)library(rstanarm)library(broom.mixed)library(ggimage)options(mc.cores =detectCores())options(tibble.width =Inf)run_model <-FALSE#whether to run the model from scratchstart_season <-2015end_season <-2023pbp <-NULLfor(s in start_season:end_season){ pbp <-load_mbb_pbp(s) |>select( tidyselect::any_of(c("game_id","game_date_time","period_number","game_half","start_half_seconds_remaining","team_id","season","away_team_id","home_team_id","away_team_name","home_team_name","home_team_spread","game_spread","home_favorite","type_id","type_text","text","coordinate_x","coordinate_y","scoring_play","home_score","away_score") ) ) |>mutate(across(contains("_id"), as.numeric) ) |>mutate(across(contains("scor"), as.numeric) ) |># filter(coordinate_x == 25, coordinate_y == 0) |> filter(type_id ==540) |>#freethrowsmutate(make_ft = scoring_play) |>bind_rows(pbp)cat("finished season ", s, "\n")}mcbb_games <- hoopR::load_mbb_schedule(start_season:end_season)#denote who is shooting the free throwsft_half_summary <- pbp |>mutate(first_half = period_number ==1) |>group_by_at(vars(game_id, game_date_time, first_half, team_id:home_favorite) ) |>summarize(fta =n(),ftm =sum(make_ft) ) |>mutate(ftp = ftm / fta) |>left_join(mcbb_games |>distinct(game_id, neutral_site, home_logo, away_logo, attendance),by ="game_id")ft_half_summary <- ft_half_summary |>mutate(ft_visiting_team =ifelse(team_id == away_team_id &!neutral_site, 1, 0),ft_team =ifelse(team_id == home_team_id, paste(home_team_name, season, sep ='-'),paste(away_team_name, season, sep ='-') ),half_chr =ifelse(first_half, "first", "second") ) |>ungroup()ft_half_summary_wide <- ft_half_summary |>select(-first_half) |>pivot_wider(names_from = half_chr,values_from =c("fta", "ftm", "ftp"),values_fill =0)#define team namesft_team_tbl <- ft_half_summary_wide |>count(ft_team) |>mutate(adj_ft_team =ifelse(n >=20, ft_team, "replacement_team"))home_team_name_tbl <- ft_half_summary_wide |>count(home_team_name) |>mutate(adj_home_team_name =ifelse(n >=15, home_team_name, "replacement_team"))ft_half_summary_wide <- ft_half_summary_wide |>left_join(ft_team_tbl |>select(-n), by ="ft_team") |>left_join(home_team_name_tbl |>select(-n), by ="home_team_name") ```# Background- College basketball has among the largest home court advantages in all of sports. - Student sections have been getting increasingly creative in their attempts to affect the outcome of opposing team shooters making their free throws.# Previous Research- [Duke medical student](https://www.dukechronicle.com/article/2023/11/duke-mens-basketball-free-throw-distractions-graduate-student-section) tabulated the miss percentage for games in the 2020-2021 and 2021-2022 seasons for various different distractions the graduate student section makes behind the basket in the second half.# Previous Research# Previous Research- Arizona State is known for its "curtain of distraction" which rose to fame in 2015 and even had a surprise distraction of shirtless olympian Michael Phelps.# Previous Research- The Harvard Sports Analytics Collective did a [study](https://harvardsportsanalysis.org/2015/02/how-distracting-is-asus-curtain-of-distraction/) in 2015 about the Arizona State "Curtain of Distraction"- Reported that visiting teams shot 60.6% from the free-throw line in the second half compared to 68.6% in the first half. - Estimated it was worth approximately 1.41 points per game. - Not a statistically significant# Previous Research- Harvard PhD student and author of the `ncaahoopR` package, Luke Benz [revisited](https://lukebenz.com/post/asu_curtain/) the Arizona State distraction in 2019 and found that there was not enough evidence to conclude that teams shoot worse against Arizona State than they do at other *road* games.# Data- Data from the 2015-2016 college basketball season until the current season's data (2023-2024). - Home teams with less than 15 games in the dataset, grouped into one collective team.- Only look at true road games, not neutral site. # Data- Group all season's together for the home team when assessing a fan base/court effect- But for the individual team shooting performances I treat each season separately# MethodologyTwo methods I explore:1. Second Half vs First Half (shooting into a rowdy student section)2. Overall effect of a home court on free throw percentage## First Half vs Second- Not every team may put a large student section behind the second half visiting team's basket- Want to assess if there is an effect for teams- Compare entire county to what we would expect due to randomness.## First Half vs Second- Only include teams with 200 free throws attempted at their home court in *both* the first half and second half in data set- Results of **largest drop-off in free-throw percentage** from the 1st half to the 2nd half```{r}statistical_test_first_second_df <- ft_half_summary_wide |>filter(ft_visiting_team ==1) |>group_by(adj_home_team_name, home_logo) |>summarize(fta_first =sum(fta_first),ftm_first =sum(ftm_first),fta_second =sum(fta_second),ftm_second =sum(ftm_second), ) |>ungroup() |>mutate(ftp_first = ftm_first / fta_first,ftp_second = ftm_second / fta_second,ftp_diff = ftp_second - ftp_first ) |>arrange(ftp_diff)``````{r}#saving off data with at least 200 fta in both halfsstatistical_test_first_second_df_for_plotting <- statistical_test_first_second_df |>filter(fta_first >=200, fta_second >=200) #adjusting for the second half higher ft%avg_ftp_half_diff <- statistical_test_first_second_df_for_plotting |>mutate(tot_fta = fta_first + fta_second) |>summarize(avg_ftp_diff =weighted.mean(ftp_diff, w = tot_fta)) |>pull(avg_ftp_diff) statistical_test_first_second_df_for_plotting <- statistical_test_first_second_df_for_plotting |>mutate(# I take off 1 percent of ftp in the second half# since on average visiting teams shoot 1 percent better in 2nd halfftp_diff_z = (ftp_diff - avg_ftp_half_diff) /sqrt( ( ftp_first*(1-ftp_first) / fta_first ) + ( ftp_second*(1-ftp_second)) / fta_second ),ftp_diff_pvalue =2*pnorm(-abs(ftp_diff_z)) ) ``````{r}min_pct <- statistical_test_first_second_df_for_plotting |>select(ftp_first, ftp_second) |>min()max_pct <- statistical_test_first_second_df_for_plotting |>select(ftp_first, ftp_second) |>max()min_pct_plot <-floor(min_pct*10)/10max_pct_plot <-ceiling(max_pct*10)/10first_vs_second_half_scatter_plot <- statistical_test_first_second_df_for_plotting |>ggplot(aes(x = ftp_first,y = ftp_second) ) +geom_smooth(method ='glm', se =FALSE) +geom_abline() +geom_image(aes(image = home_logo)) +ggtitle("Visiting Team's Free Throw Percentage by Half",subtitle ="2015-16 to 2023-24 Seasons (Min 200 FTA in Each Half)") +xlab("First Half %") +ylab("Second Half %") +xlim(min_pct_plot, max_pct_plot) +ylim(min_pct_plot, max_pct_plot) +theme_bw() +theme(aspect.ratio =1) first_vs_second_half_scatter_plot```## First Half vs Second```{r}statistical_test_first_second_df_for_plotting |>ggplot(aes(x = ftp_diff)) +geom_histogram() +geom_vline(xintercept =0, color ='red', linetype =2) +theme_bw() +xlab("% Difference (2nd - 1st)") +ggtitle("Visiting Team's Free Throw Percentage Change by Half",subtitle ="2015-16 to 2023-24 Seasons (Min 200 FTA in Each Half)")```## First Half vs Second- In fact, on average, visiting teams shoot `r round(avg_ftp_half_diff*100)` percent *better* in the second half than compared to the first.- Could be due to the effect of the end of game scenarios in basketball. - If a team is winning and getting fouled it does its best to get the ball into the hands of their best free throw shooters.- Hard to test this theory - Would need to go with free throw share by players conditional on time remaining and score.- I adjust p-values and z-scores by taking off an additional 1% of all 2nd half FT%## First Half vs Second```{r}ftp_half_diff_gt_table <- statistical_test_first_second_df_for_plotting %>% dplyr::select(home_team = adj_home_team_name, home_logo, ftp_first, ftp_second, ftp_diff, ftp_diff_pvalue ) %>%gt() %>%cols_label(home_team ="Home Court",home_logo ="",ftp_first ="1st",ftp_second ="2nd",ftp_diff ="Diff",ftp_diff_pvalue ="PValue" ) %>%# # text_transform(# # locations = cells_body(c("fbref_logo_url")),# # fn = function(x) {# # map(x, ~ web_image(.x))# # }# # ) %>% # tab_style(# style = cell_text(weight = "bold"),# locations = cells_column_labels()# ) %>%cols_align(align =c("center"),columns =everything() ) %>%fmt_percent(columns = ftp_first:ftp_diff,decimals =0) %>%fmt_number(columns = ftp_diff_pvalue,decimals =2) %>%gt_img_rows(columns = home_logo, img_source ="web", height =30) %>%tab_header(title ="Visiting Free Throw % by Half",subtitle ="2015-16 to 2023-24 Seasons" ) %>%# gt_theme_538() %>%data_color(columns =c(ftp_first, ftp_second, ftp_diff, ftp_diff_pvalue),colors = scales::col_numeric(palette =viridis(10),domain =NULL) # You can adjust the number of colors as needed ) %>%opt_interactive()ftp_half_diff_gt_table```## First Half vs Second- Arizona State: "Curtain of Distraction" - BYU, has a wild student section behind the basket in the second half as well## First Half vs Second - Chance?- Significance Test?- Multiple test corrections - Bonferroni: $\frac{\alpha}{n}$ - $n=355$ teams in our dataset, extremely high standard## First Half vs Second - Chance?QQ Plot```{r}qq_plot_data <- statistical_test_first_second_df_for_plotting |>select(ftp_diff_z, ftp_diff_pvalue) |>arrange(ftp_diff_z) |>mutate(normal_quantile_z =qnorm(row_number()/n()))``````{r}qq_plot <- qq_plot_data |>ggplot(aes(x = ftp_diff_z,y = normal_quantile_z)) +geom_point() +geom_abline() +xlab("Observed Z-values") +ylab("Theoretical Z-values") +theme_bw() +xlim(-3.3,3.3) +ylim(-3.3,3.3) +theme(aspect.ratio =1) +ggtitle("QQ Plot")qq_plot```## Full Game Effect Model- College basketball has many teams in Division I with no stands behind the basket or no students.- Can analyze general specific home court effect on visiting team's true ability in free-throw shooting percentage.## Full Game Effect Model- Samples sizes really are too small to do any player-level analysis- Stick to team-level analysis- A team's FT % in road game minus average FT % in home games## Full Game Effect ModelWhat is a better comparison: - Free Throw Percentage at home games?- Free Throw Percentage at other raod games?## Full Game Effect ModelI used home games - More consistent data set (other road games have many different changing variables) - Power conference teams typically have may more home games than true road games.## Full Game Effect ModelThis model doesn't- Account for travel to higher elevations (my [previous work](https://www.espn.com/blog/statsinfo/post/_/id/130346/bracket-tips-from-the-basketball-power-index) at ESPN showed this to matter a lot)- Day's rest for teams- Distance traveled- Individual player affects on FT% (assume this averages out over a season)## Full Game Effect ModelMy model can be defned as\begin{align}y_i &= \beta_0 + \gamma_j + \epsilon\\\gamma_j &\sim Cauchy(0,1)\\\epsilon & \sim N(0,\sigma^2)\end{align}- $y_i$ is the difference the visiting team's free throw percentage in game $i$ and its free throw percentage in al their home games that season. - $\gamma_j$ is the effect of the home team $j$'s - Weight the observations by the total number of free throw attempts in the game.# Results- Use posterior draws for the team effects to calculate the estimated effect a team's home court has on the opposing team's free throw percentage. - Calculate the posterior *probability* that a team's home court has an effect that decreases the probability of an opponent making a free throw. ```{r}### For simpler method: calculate home team ft% for each season## model only away games the difference in ft% vs homeft_half_summary_wide <- ft_half_summary_wide |>mutate(fta_game = fta_second + fta_first,ftm_game = ftm_second + ftm_first)#ft percentage in non-away gamesteam_season_home_ft_pct <- ft_half_summary_wide |>filter(ft_visiting_team ==0) |>group_by(adj_ft_team) |>summarize(tot_fta =sum(fta_game),tot_ftm =sum(ftm_game),games =n(),avg_fta =mean(fta_game),avg_ftm =mean(ftm_game),avg_ftp =sum(ftm_game) /sum(fta_game) )away_team_game_summary <- ft_half_summary_wide |>filter(ft_visiting_team ==1) |>left_join(team_season_home_ft_pct |>rename_at(vars(tot_fta:last_col()), ~paste0("home_court_", .x) ),by =c("adj_ft_team") ) |>mutate(ftp_game = ftm_game / fta_game,diff_ftp_from_home = ftp_game - home_court_avg_ftp)if(run_model){ diff_ftp_model <-stan_lmer(diff_ftp_from_home ~1+ (1| adj_home_team_name),#the home court team data = away_team_game_summary,prior =cauchy(),weights = fta_game,iter =800,chains =4) diff_ftp_model |>write_rds("diff_ftp_model.rds")}else{ diff_ftp_model <-read_rds("diff_ftp_model.rds")}```# Results```{r}# summary(diff_ftp_model)#avg home court effectshome_team_effect_draws <- tidybayes::spread_draws(diff_ftp_model, b[term,group]) |>mutate(home_team_name =str_remove(group, "adj_home_team_name:") |>str_replace_all("_", " ")) |>rename(home_effect = b) |>ungroup() |> dplyr::select(-term,-group )home_team_ft_effect_summary <- home_team_effect_draws |>group_by(home_team_name) |>summarize(prob_less_0 =mean(home_effect <0),avg_effect =mean(home_effect),sd_effect =sd(home_effect) ) |>ungroup() |>arrange(desc(prob_less_0), avg_effect) |>left_join(ft_half_summary_wide |>distinct(home_team_name, home_logo) |>na.omit(),by =c("home_team_name"))home_team_ft_effect_summary_gt_table <- home_team_ft_effect_summary %>% dplyr::select(home_team = home_team_name, home_logo, avg_effect, sd_effect, prob_less_0 ) %>%gt() %>%cols_label(home_team ="Home Court",home_logo ="",avg_effect ="Effect on FT%",sd_effect ="Std. Dev.",prob_less_0 ="Prob(Effect < 0)" ) %>%# # text_transform(# # locations = cells_body(c("fbref_logo_url")),# # fn = function(x) {# # map(x, ~ web_image(.x))# # }# # ) %>% # tab_style(# style = cell_text(weight = "bold"),# locations = cells_column_labels()# ) %>%cols_align(align =c("center"),columns =everything() ) %>%fmt_percent(columns = avg_effect:prob_less_0,decimals =1) %>%gt_img_rows(columns = home_logo, img_source ="web", height =30) %>%tab_header(title ="Home Team's Venue Effect on Visiting Free Throws",subtitle ="Hierarchical Bayesian Model Using 2015-16 to 2023-24 Seasons" ) %>%# gt_theme_538() %>%data_color(columns =c(avg_effect, sd_effect, prob_less_0),colors = scales::col_numeric(palette =viridis(10),domain =NULL) # You can adjust the number of colors as needed ) %>%opt_interactive()home_team_ft_effect_summary_gt_table```# ResultsWe can compare evidence of 2nd half effects to overall modeled affect of home crowd/court.```{r}both_ft_impact_plot <- home_team_ft_effect_summary |>left_join(statistical_test_first_second_df_for_plotting |>select(home_team_name = adj_home_team_name, ftp_diff_z),by =c("home_team_name") ) |>filter(!is.na(ftp_diff_z)) |>ggplot(aes(y = avg_effect, x = ftp_diff_z)) +geom_image(aes(image = home_logo)) +geom_smooth(method ='glm', se =FALSE) +theme_bw() +ylab("Home Court Effect per Game (Pct.)") +xlab("Z-Score Second Half minus First") +annotate("text", x =-2.25, y =-0.036, label ="Whole Game Effect & 2nd Half") +ggtitle("Impact on Visiting Team Free Throws by Home Court",subtitle ="2015-16 to 2023-24")both_ft_impact_plot```# ResultsOrder of Magnitude for 2nd Half FTA:- Average FTA per game: `r mean(away_team_game_summary$home_court_avg_fta)`.- Say average 2nd half FTA are `r round(mean(away_team_game_summary$home_court_avg_fta)/2)`- Impact per game in 2nd half is about: `r round((mean(away_team_game_summary$home_court_avg_fta)/2) *min(statistical_test_first_second_df_for_plotting$ftp_diff) ) `for the largest team effect.# ResultsOrder of Magnitude for whole game FT% Effect:- Average FTA per game: `r mean(away_team_game_summary$home_court_avg_fta)`.- Impact per game is about: `r floor(mean(away_team_game_summary$home_court_avg_fta) *min(statistical_test_first_second_df_for_plotting$ftp_diff) )` for the largest team effect.# Conclusion- A handful of teams have clear evidence of a 2nd half effect- A handful of teams have clear evidence of teams shooting worse at FT's in their stadium - Confounded with altitude, distanc traveled- Should get more teams to try 2nd half distractions!