Background
College basketball holds a special place in my heart. My sister “snuck” me into Cameron Indoor Stadium posing in 10th grade when I posed as one of her graduate student friends. I was there for Jimmermania in 2011. My first published research paper was about college basketball TV audiences in the Final Four. My first major project at ESPN was to redo the college Basketball Power Index (BPI) and create Strength of Record (SOR). My algorithm is still what feeds those rankings on the NCAA selection committees team sheets.
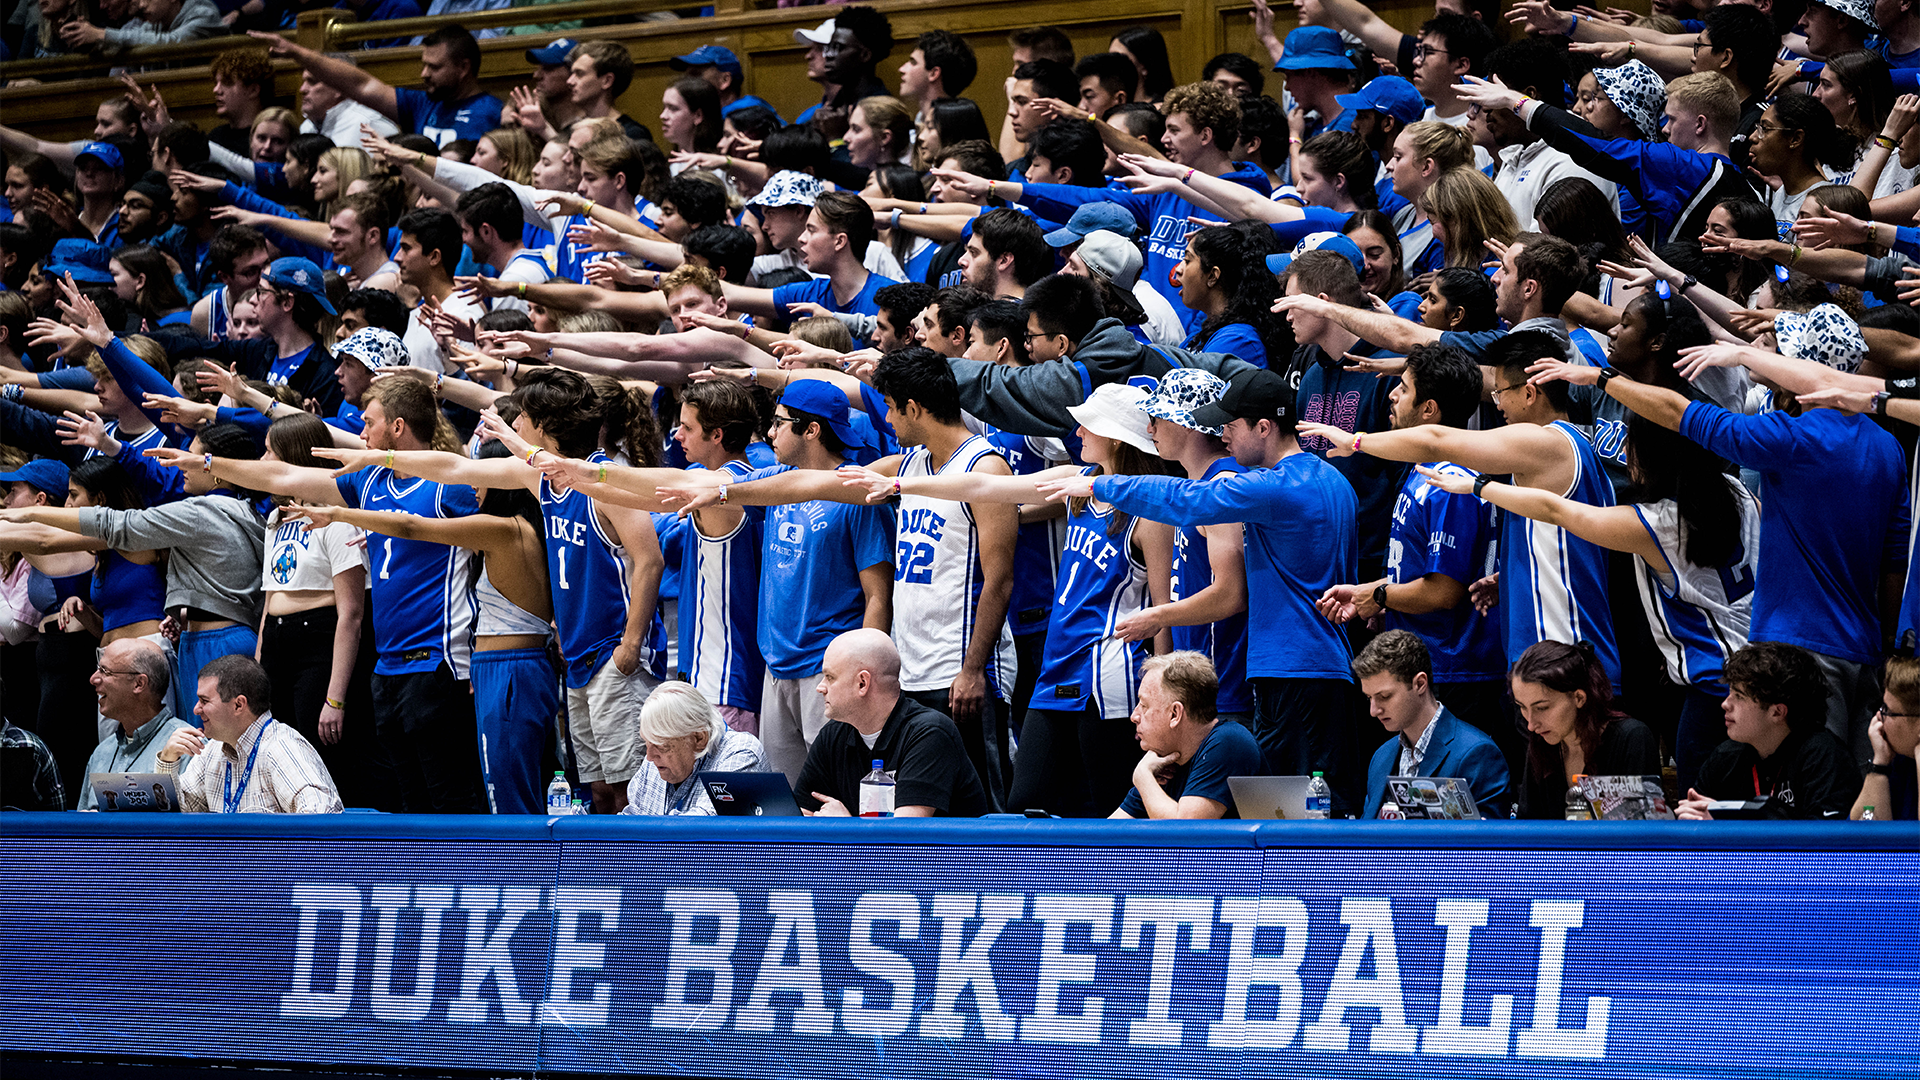
It is no secret that college basketball has among the largest home advantages in all of sports. There’s many possible reasons why. From travel, rest, unfamiliarity of surroundings to more tangible ones like using a different basketball team to team to the uniqueness of college student sections. In the last decade student sections have gotten much more creative in their attempts to affect the outcome of opposing team shooters making their free throws.
Previous Research
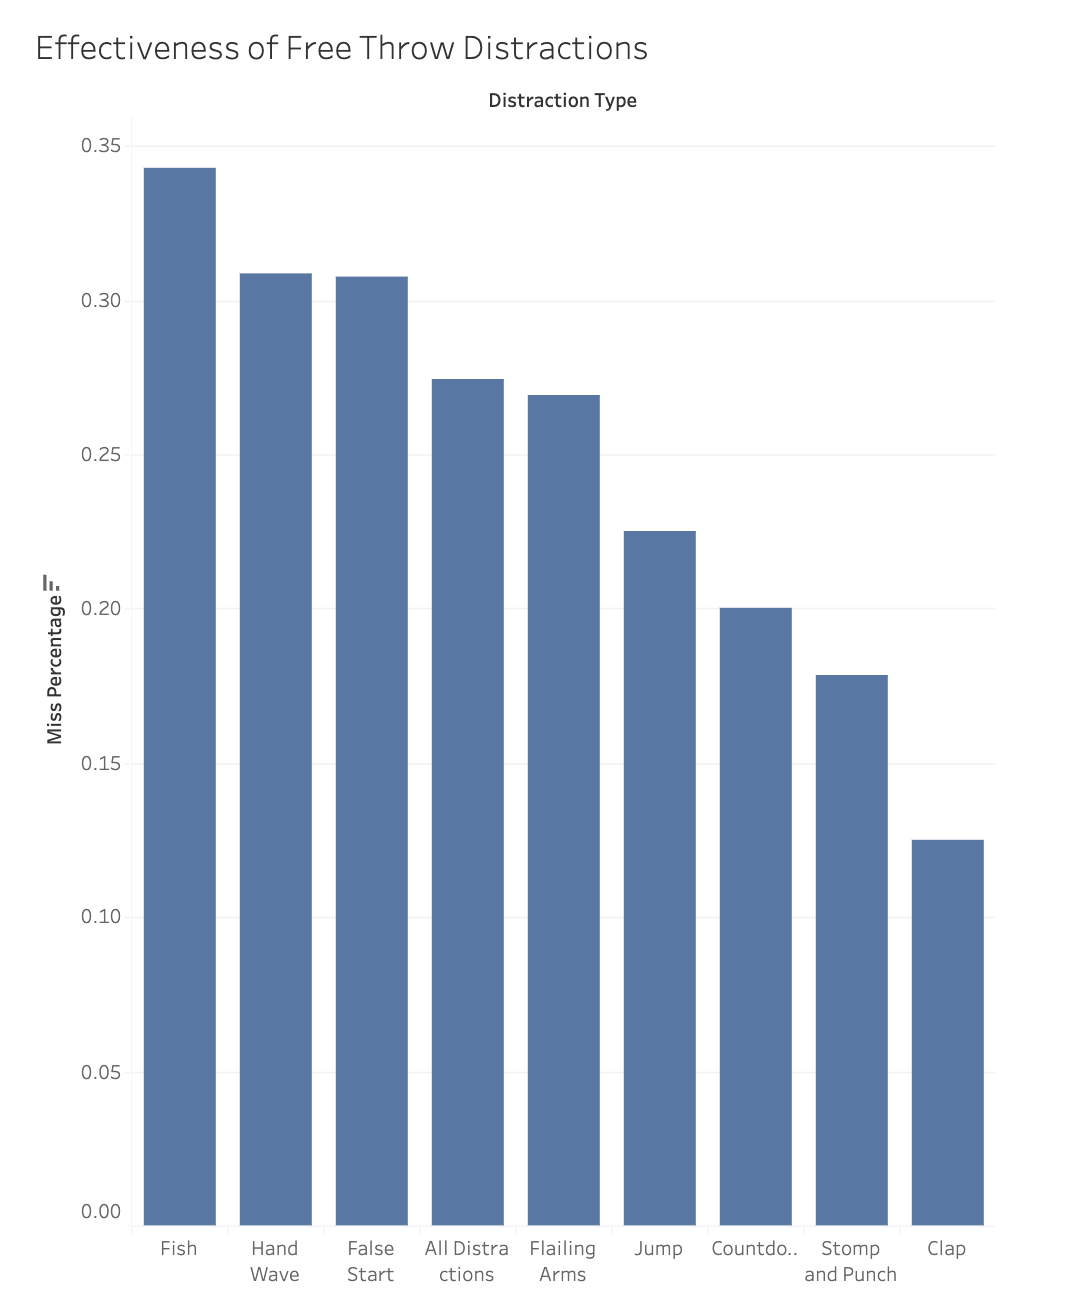
A Duke medical student tabulated the miss percentage for games in the 2020-2021 and 2021-2022 seasons for various different distractions the graduate student section made behind the basket in the second half.
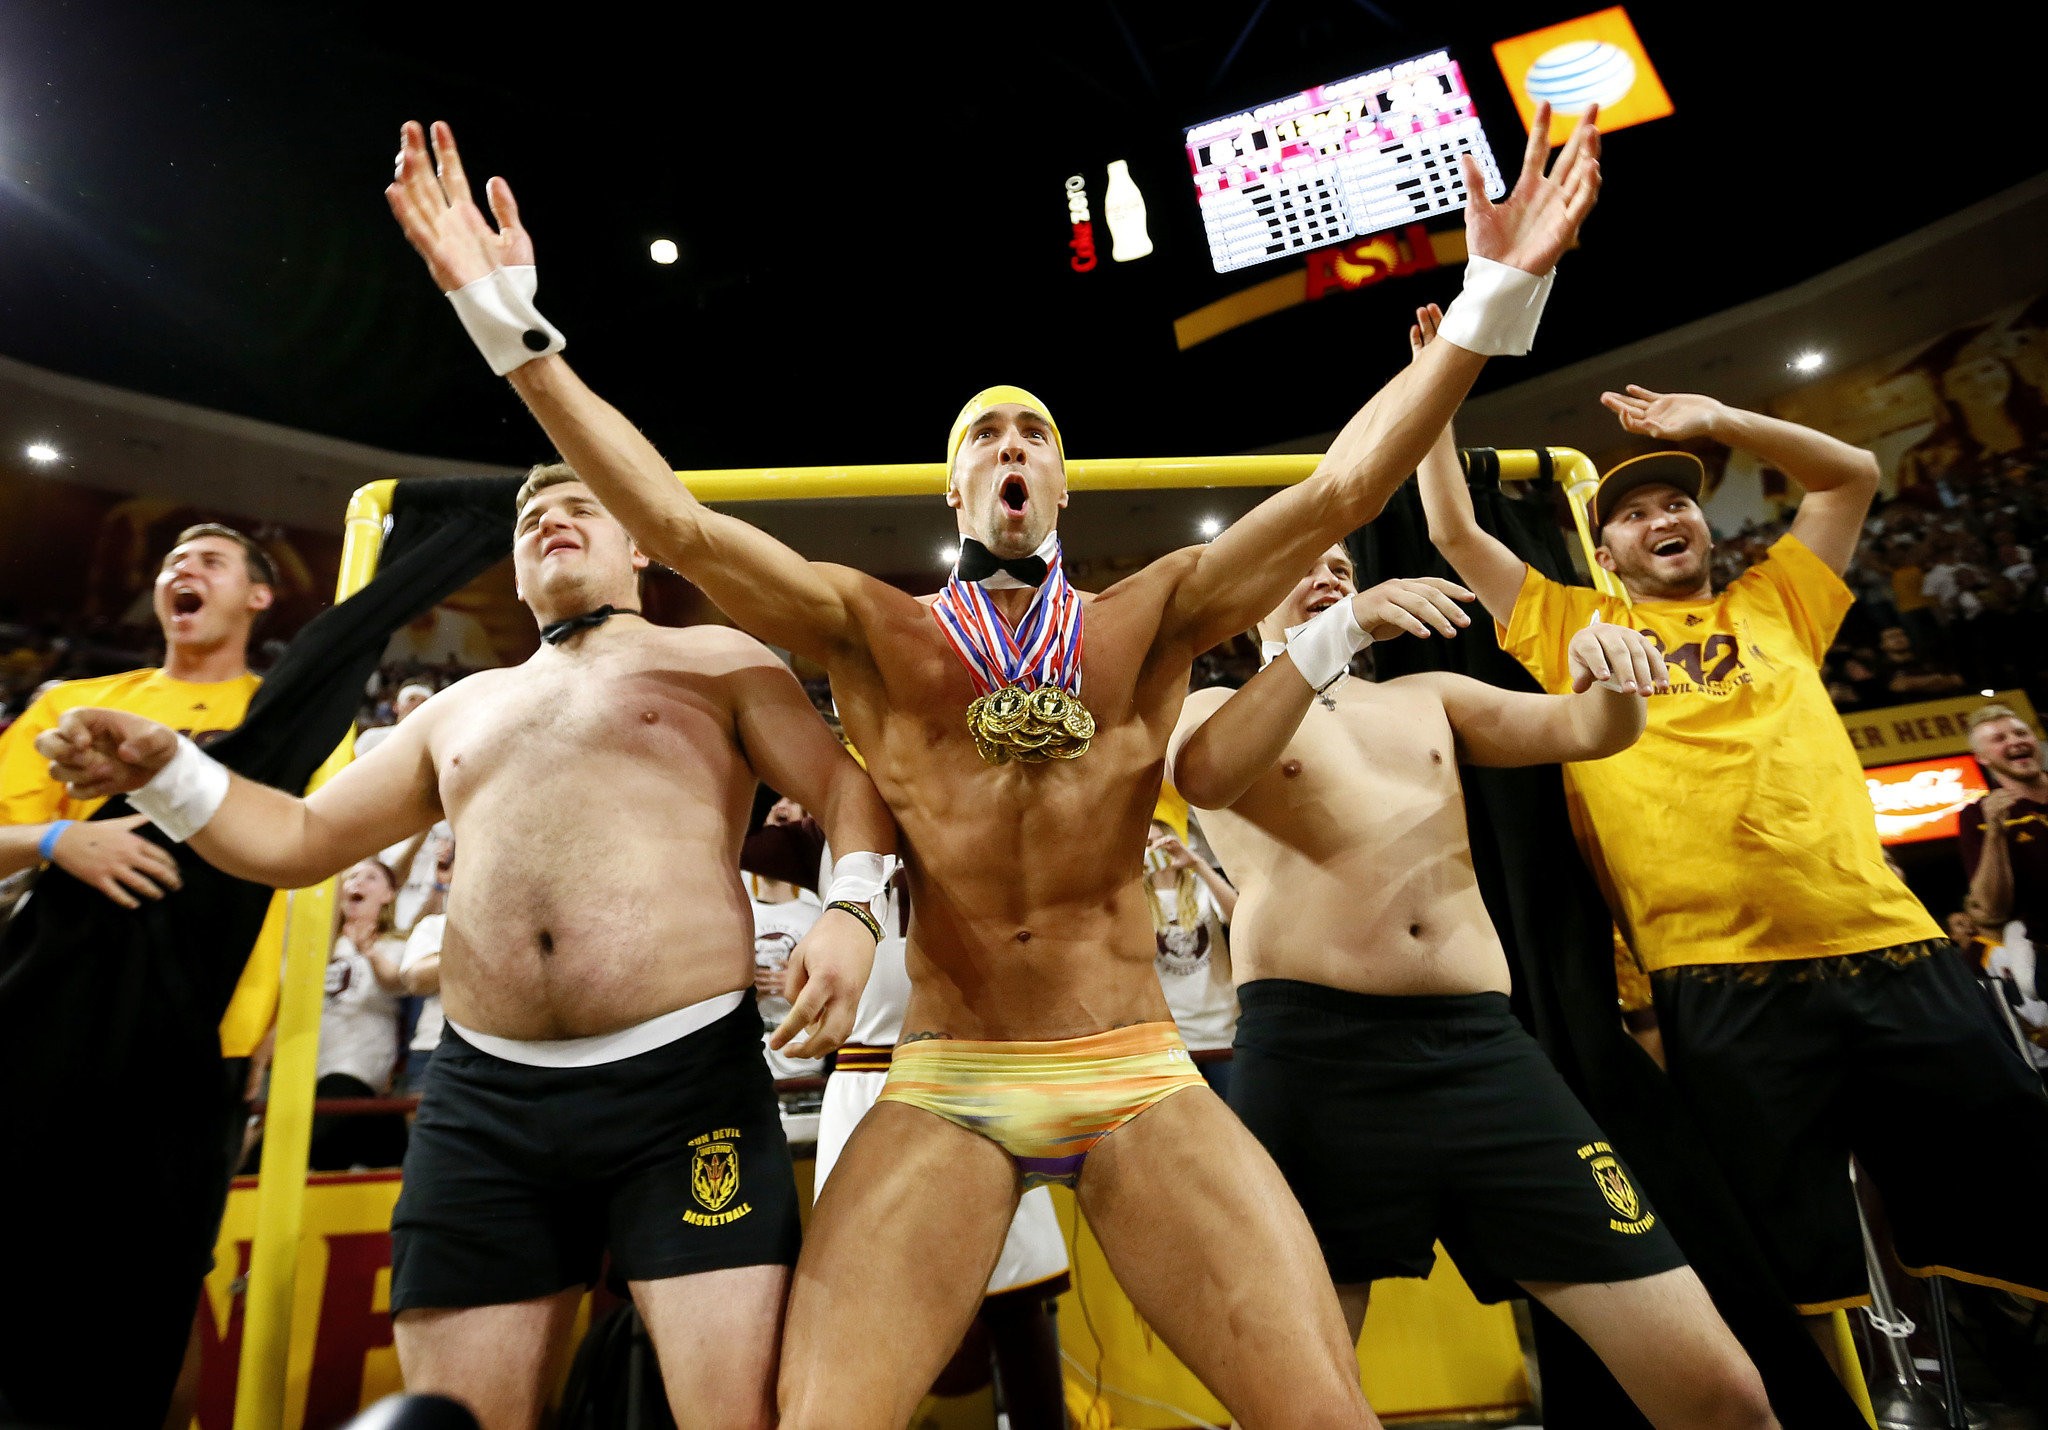
Arizona State is known for its “curtain of distraction” which rose to fame in 2015 and at that time had a surprise distraction of shirtless olympian Michael Phelps.
The Harvard Sports Analytics Collective did a study in 2015 about the Arizona State’s “Curtain of Distraction” and reported that visiting teams shot 60.6% from the free-throw line in the second half compared to 68.6% in the first half. Their estimate was that this distraction was equal to approximately 1.41 points per game. They reported that there was not a statistically significant difference between first half and second half free throw percentages due to the small sample size of their data.
Luke Benz, a current Harvard PhD student and author of the ncaahoopR package, revisited the Arizona State distraction in 2019 and found that there was not enough evidence to conclude that teams shoot worse against Arizona State than they do at other road games.
Surely with another 5 years of data one should be able to discern once and for all if Arizona State’s students have made a noticeable effect and if other teams have had similar impacts as well.
Data
I used data from the 2015-2016 college basketball season until the current season’s data (2023-2024). I excluded the 2020-21 seasons due to many arenas not having fans at their games due to the reaction to the COVID-19 pandemic. I grouped any home team that has less than 15 games in the dataset into one collective team.
I made sure to only look at true road games, not games where the visiting team is playing at a neutral site. Whether or not something is listed as neutral site is sometimes subjective, I used the neutral site tag that can be found via the ESPN.com API.
Methodology
Each of the previous methods take a slightly different approach to estimating a crowd’s affect on free throw shooting. Each has its advantages but with more seasons I will attempt to revisit the 2nd half analysis as well as estimate which home venues affect free throws throughout the game as opposed to only the second half.
2nd Half Student Section Effect
I filtered the data to teams that have at least 200 free throws attempted at their home court in both the first half and second half over the course of this data set. The top 10 in terms of largest drop-off in free-throw percentage from the first half to the second half can be seen in the table below.
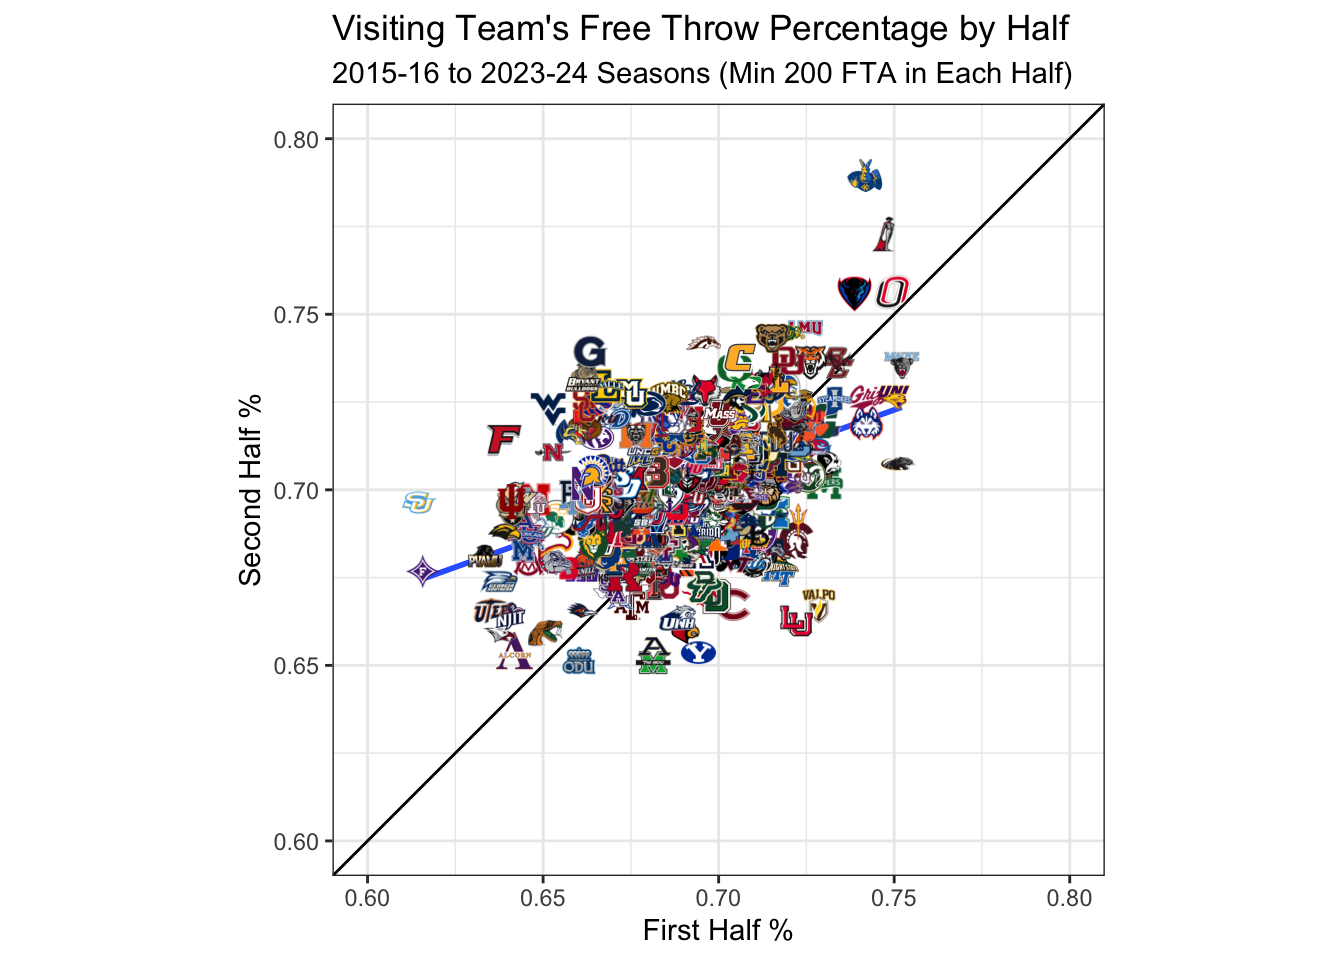
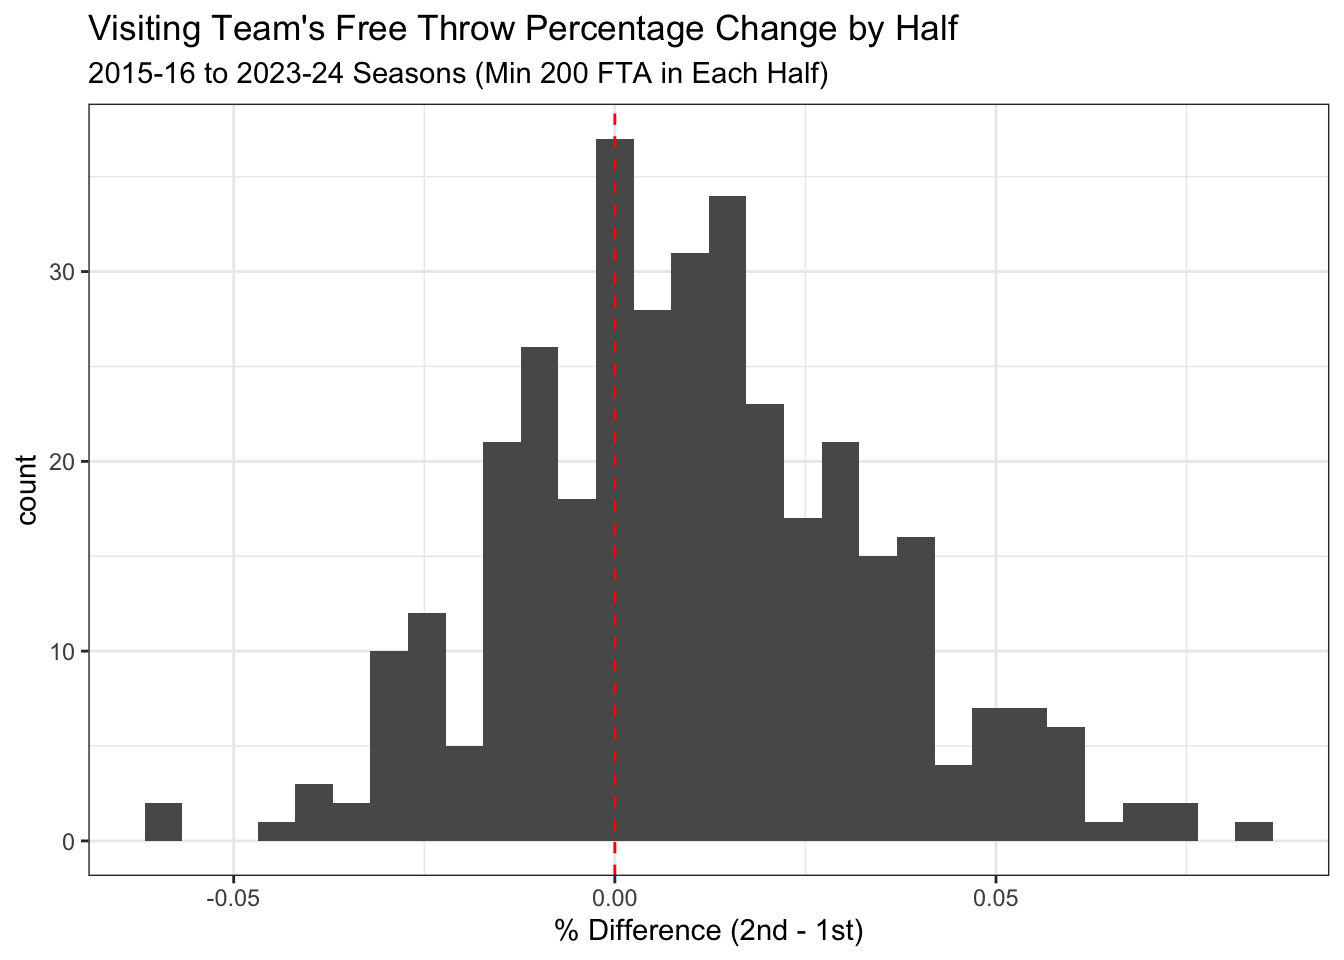
I also plotted the histogram of the differences in free throw percentage from the first half to the second half by each home team. What is suprising in looking at first glance is that, on average, visiting teams shoot 1 percent better in the second half than compared to the first.
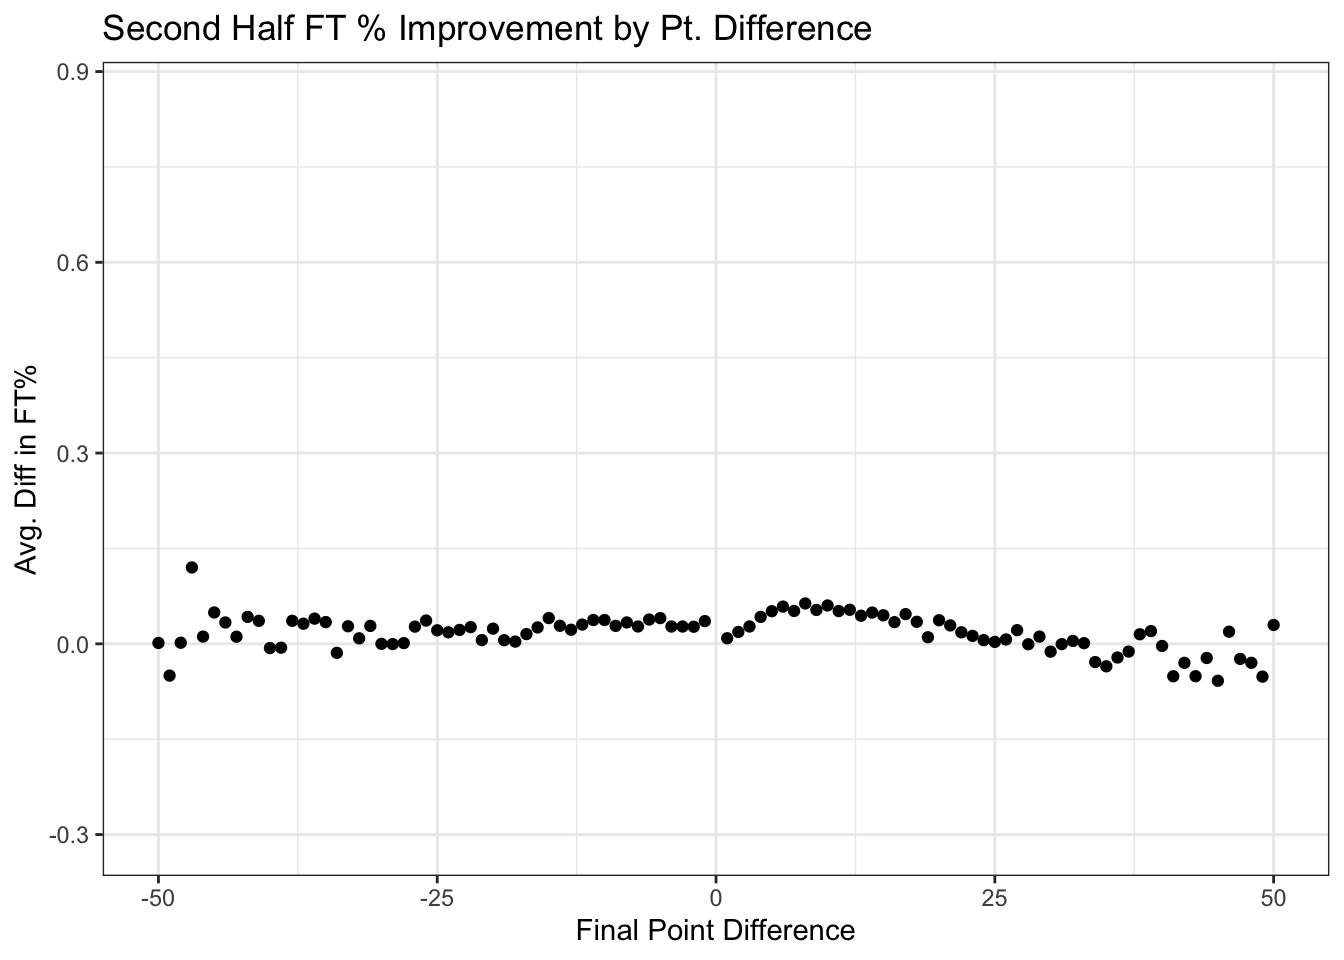
This is likely due to the effect of the end of game scenarios in basketball. Typically, if a team is winning the losing team starts to foul towards the end of the game. The winning team knows this will happen and does its best to get the ball into the hands of their best free throw shooters before these fouls occur. You can see this trend in the following plot, where the difference in 2nd half free throw percentage goes up when a team wins by about 5-10, which is typically the range of outcomes where the other team was fouling.
This doesn’t explain the entire effect as even teams that lose tend to shoot better percentage wise for free throws in the second half. There’s several possible explanations for this but my intuition was that as players got tired their free-throw percentages would decrease in the second half, which doesn’t appear to be the case.
To somewhat account for this second half effect I take that one percent in the second half off of a team’s free throw percentage when assessing the difference between the first half and the second half via the z-score and p-value.
There are some familiar names, including our famous “Curtain of Distraction” team, Arizona State among the biggest drop offs from the first half to the second, and with the additional years of data, the result is statistically significant.
BYU, another team that is increasingly known for its wild student section behind the basket in the second half, is also high on this list. While I don’t have data on all the teams and where their student sections are I did quick research on where many of the teams in the top 10 of this list have their student sections in the second half.
- Valparaiso: behind visiting basket
- Lamar: I couldn’t find
- Milwaukee: behind visiting basket
- Arizona State: behind visiting basket
- BYU: behind visiting basket
- Middle Tennessee State: behind visiting basket
Some not surprising names appear near the top of this list. Although, it is possible that with over 350 Division I basketball teams, that some by shear randomness, some will have a significant first half to second half effect on opposing free throw shooters.
There are some corrections for significance testing for multiple tests that one can do such as the Bonferroni correction which would lower a significance threshold by dividing by the number of tests, so if we had a \(\alpha = 0.05\) threshold the new one would be \(\frac{\alpha}{n}\) where \(n=355\) teams in our dataset. Bonferroni is known for being overly conservative, and this surely would be an extremely high standard.
I used the Benjamini–Hochberg procedure to determine if there are some values for which one should still reject the null hypothesis that second half free throw percentage shouldn’t decrease from the first for a team. (Remember that I adjusted for the fact that on average second half free throw percentages increase by 1 percent that of the first half.) Unfortunately there are also no teams that clear this multiple testing threshold.
This brought me to an interesting conundrum in this analysis. I allowed every team in the nation in my sample. If I restricted it to ones I had specific hypotheses about them this would be stronger evidence. Arizona State was one of those teams. In isolation its effect is explained beyond randomness alone. I went to BYU and was curious about their fans and certainly, in isolation, their student section seems to impact free throw shots from the visiting team.
This simple analysis is not accounting for specific free throw shooters ability and game situation which muddies the results. In my personal opinion, there is a mechanism, such as the students displaying distractions behind the basket, that explains why certain teams may have an effect. To me, that enhances the evidence.
If I were smart, I wouldn’t be testing this for every team in the country, but only for teams that I know have their students behind the basket trying to distract the shooter. That is a minority of the 350+ schools in the nation. Most stadiums don’t have that atmosphere.
Entire Game Effect
Everything so far has been to look at the first half vs the second half free throw percentage for each team. Some teams don’t put their student sections behind the basket or don’t have a set routine to distract shooters. In fact, college basketball has many teams in Division I with no stands behind the basket whatsoever.
A different way to analyze the affect a crowd has on free throw shooting would be to build a model that adjusted for the visiting team’s true ability in free throw shooting percentage. This model would ignore half by half effects and simply look at each game as a whole.
Why Use Team Performance?
Free throws should follow a Poisson-Binomial process. While each shot is an independent event, the probability of success should vary because each player has a different shooting ability. Player shooting samples sizes are too small for game by game analysis, so I stuck to using a team’s free throw shooting percentage on a game to game basis. I used the difference of the visiting team’s free throw shooting percentage in that game to its free throw shooting percentage in home games that season.
Others have pointed out that it is not clear whether a better comparison for effectiveness of a crowd would be to compare free throw percentage of the visiting team’s other road games or to compare them to their home games.
I chose home games. I did this because each team’s home games are in the same location each time, reducing the effect that a unique road schedule may have on teams in certain conferences more than others. One example would be teams that have to, on average, travel further or to higher elevations in their conference. My previous work on BPI and SOR at ESPN consistently showed elevation to have an effect on team efficiency in college basketball and this paper from Lopez, Matthews, & Baumer suggested market lines adjust for it in professional sports.
For the purposes of assessing which fan bases may have an effect, I grouped all season’s together for the home team when assessing a fan base, but for the individual team shooting performances I treated each season separately.
My model can be defined as
\[\begin{align} y_i &= \beta_0 + \gamma_j + g(x_{1,i})\boldsymbol{\beta} + \epsilon\\ \gamma_j &\sim Laplace(0,1)\\ \epsilon & \sim N(0,\sigma^2) \end{align}\]where \(y_i\) is the difference the visiting team’s free throw percentage in game \(i\) and its free throw percentage in their home games that season. \(\gamma_j\) is the effect of the home team \(j\)’s home crowd/venue on the free throw percentage for the visiting team. \(g(x_i)\) is a nonlinear natural spline on the absolute value of the final score margin. This was motivated by wanting to adjust for free throw differences in games that are close at the end compared to others.
The home venue effect is given a Laplace prior distribution centered around 0. The Laplace prior is equivalent to LASSO regression and shrinks estimates towards 0. I also weighted the observations by the total number of free throw attempts in the game.
This method can’t differentiate between crowd effects and the effect of long travel or high elevation since that data wasn’t as readily available. The model should be able to account for differences in visiting teams free throw ability, overall difficulty of shooting free throws on the road, the effect of close games, and the empirical average impact of the venue played at.
Results
Using the posterior draws for the team effects from the model I calculated the estimated effect a team’s home court has on the opposing team’s free throw percentage. I also calculated the probability that a team’s home court has an effect that decreases the probability of an opponent making a free throw above that of the average road venue.
| term | estimate | std.error |
|---|---|---|
| (Intercept) | -0.012 | 0.001 |
| ns(abs(team_pt_diff), df = 3)1 | -0.093 | 0.002 |
| ns(abs(team_pt_diff), df = 3)2 | -0.048 | 0.003 |
| ns(abs(team_pt_diff), df = 3)3 | -0.065 | 0.006 |
The negative coefficients of the absolute value of the scoring difference confirms that there is an effect of a close game on free throw percentage. Closer games have higher free throw shooting percentages. The intercept is interpreted as the average change in free throw percentage for playing on the road versus at home (a decrease of 1.2%).
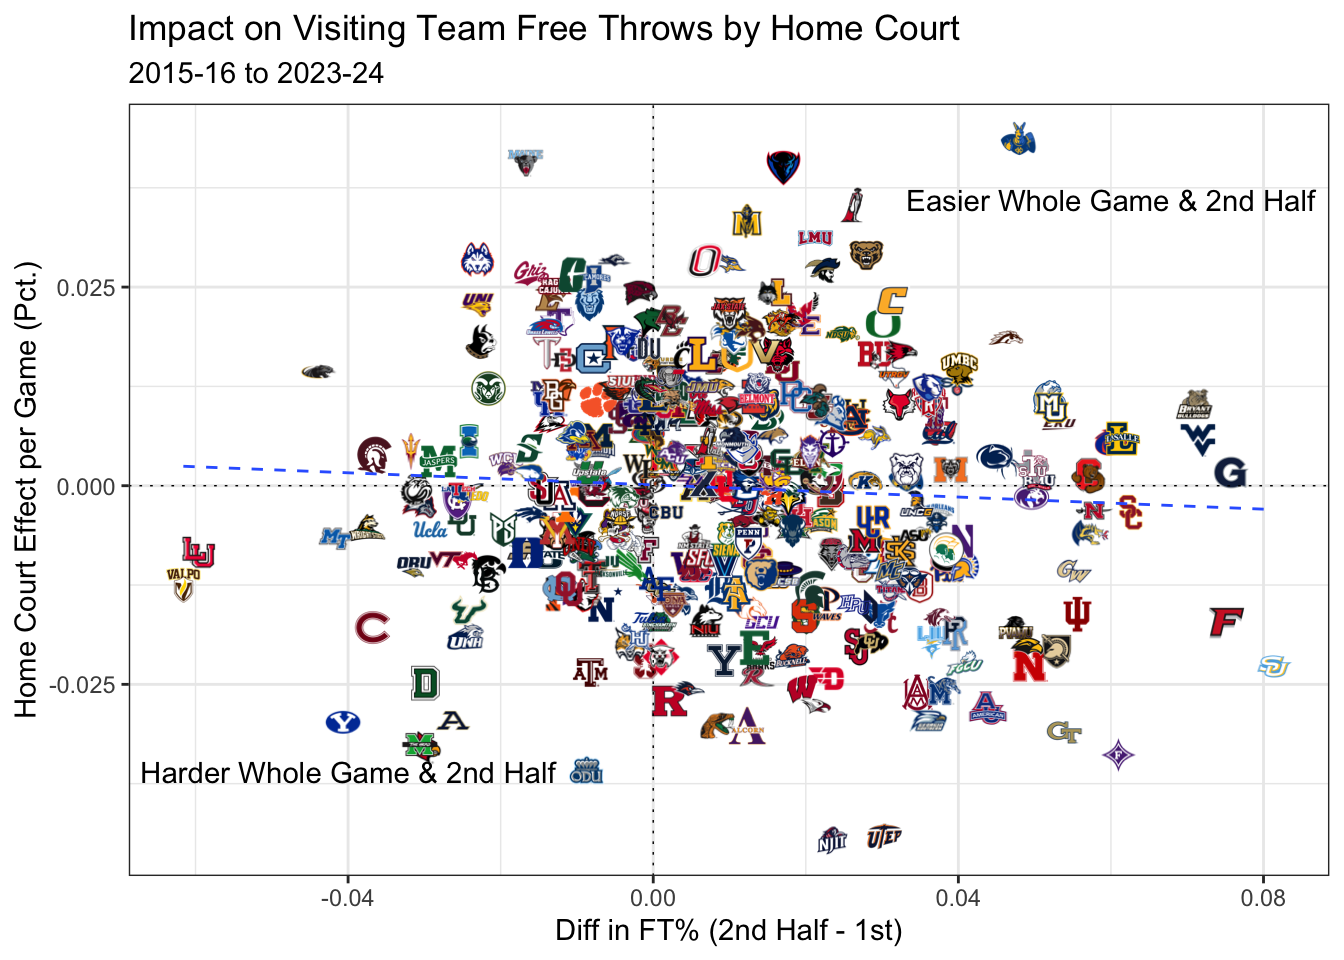
There are a lot of teams that have a noticeable effect beyond that of an average team. I combined the effects estimated on 2nd half free throws and the game impact of a venue on visiting team’s free throw percentage.
There isn’t a much of a relationship between the two, but some teams in the lower left hand corner have a noticeable impact in the second half compared to the first and as a whole throughout the entire game.
Conclusion
Although a handful of teams have a statistically significant impact on 2nd half free throw percentage compared to first for the visiting team, it doesn’t hold up if one adjusts for testing every team in the country. If you were to do a multiple test on only teams with student sections behind the visiting team’s second half basket (data I don’t have) it likely would hold up for some teams under a multiple tests adjustment.
The magnitude of the effect is important here. The average free throw attempts (FTA) per game is 20.3. The average 2nd half FTA per game is 11.3. That means the impact of the crowd with the largest second half free throw effect is roughly 0.7 points per 2nd half.
For the whole game, teams playing at NJIT had a -4.5% estimated decrease in free throw percentage. This would equate to a \(0.045*20.3 = 0.9\) points per game impact based on free throws alone over the average venue in the country. That is something! But it is a bit smaller than the 1.4 points per game for Arizona State that was estimated in previous work.
It’s important to note that effects for the entire game are confounded with altitude, distance traveled and day’s rest. Certain visiting team’s schedules may over index on those factors than others, meaning it may be more than just the crowd that impacts a visiting team’s free throws at one venue over this study period.
So can a good crowd impact the road team’s free throw making? I think the evidence suggests that it can! But … that effect is at the extreme end no more than 1 point per game or 0.7 points in the second half.