Who has the Biggest Home-Field Advantage? It’s Not Who You Think.
Why EA Sports new college football game’s home field advantage rankings are not backed by data.
college football
home field advantage
football
sports analytics
EPA
Author
Paul Sabin
Published
Tuesday, July 9, 2024
EA Sports Hardest Places to Play
College Football fans (including me) cannot wait for the new College Football 25 video game to come out. As part of the game there are team rankings provided by EA sports in addition to rankings of the 25 hardest places to play.
The top of the hardes places list is a who’s who of college football. EA Sports mentions the rankings of the toughest places to play come from a combination of “home winning %, home game attendance, active home winning streaks, team prestige, and more.”
The top 10 venues listed by EA Sports are also in the top 20 in total capacity across College Football. Clearly stadium capacity is correlated in EA’s mind with being a tough place to play.
Good Teams - All They Do Is Win
Can we disentengle home team ability from a home field advantage? Alabama’s winning percentage at home in the Nick Saban era (2007-2023) was 93% which is the highest of any FBS team in that timespan.
So is Bryant-Denney Stadium a particularly hard place to play? In short of course it is. Just look at how rarely Alabama has lost there. But there’s no evidence that it is any more difficult of a place to play than the average college football home venue after adjusting for the home team. Don’t believe me? Well in 21 neutral site games over that same time Alabama had a 95% winning percentage and even had a 84% winning percentage on the road. So while 84% on the road is worse, Alabama’s road schedule is almost exclusively against SEC teams while they typically have one or two non-power conference (including FCS) home games each year.
While they do boast a raucous crowd and it can be very hot and humid in Tuscaloosa, but the most difficult thing about winning there is the players wearing crimson on the field, not the stadium or the crowd.
Home vs Road
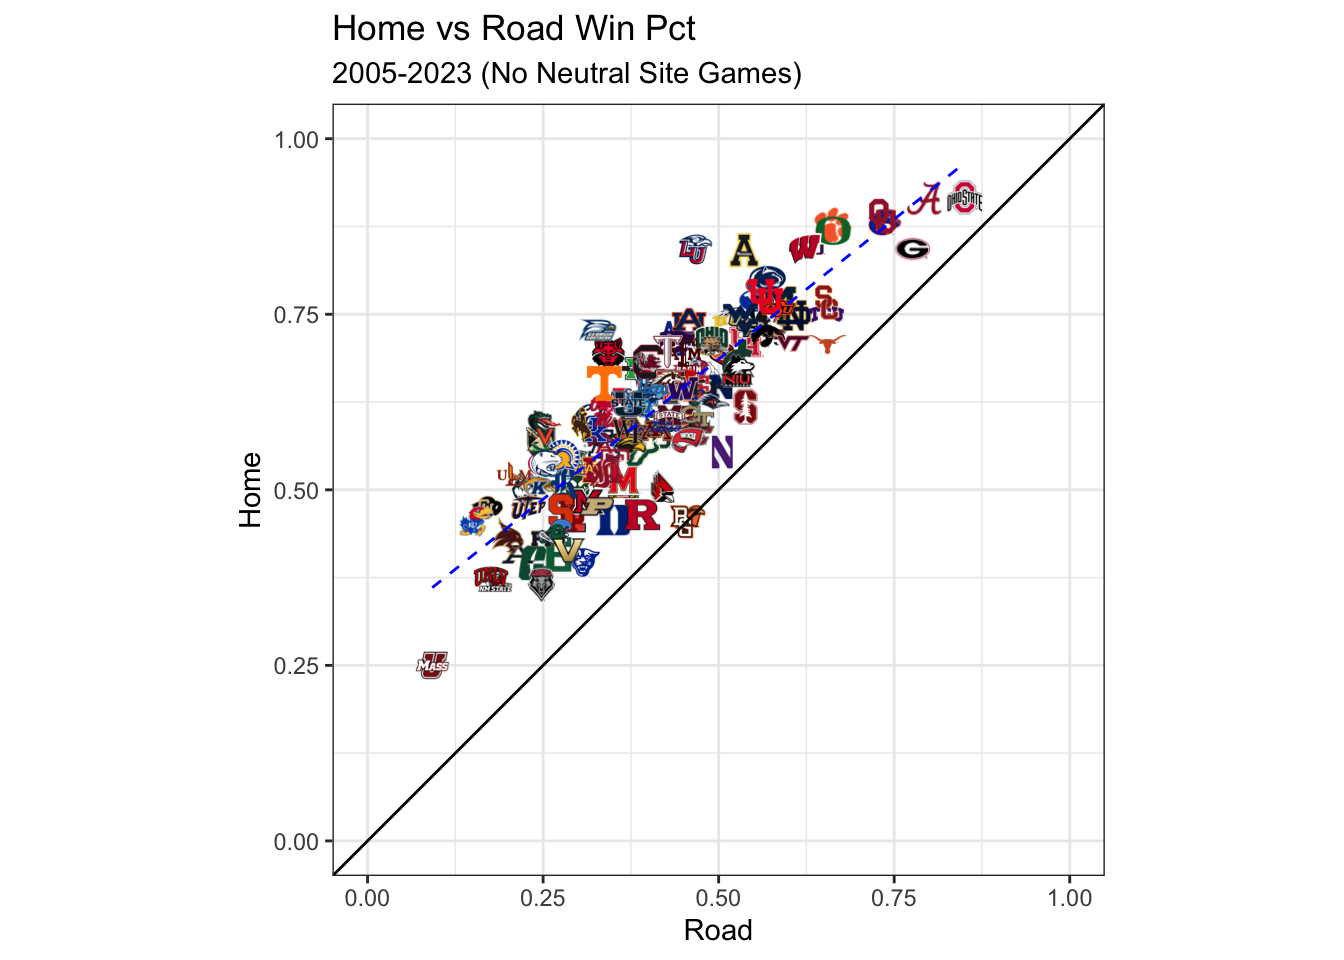
Theoretically, all else being equal, teams that have a bigger home field advantage should have a bigger difference of performance at home vs on the road. That could be in winning percentage or in efficiency (points or EPA per play or drive). The problem is, in college football, nothing is equal between teams or between road and home schedules. Let’s look at winning percentage the last 19 seasons on the road versus at home.
If everything else was equal, teams with bigger HFA would be further away to the top and left of the dotted blue line and teams with smaller HFA would be below the dotted blue line. The black line represents an equal winning percentage on the road and at home. There isn’t a school in this time span with a worse home winning percentage than road winning percentage.
What is Home Field Advantage?
Home field advantage is well studied and documented. But do some teams have a larger home field advantage than others? In order to answer that we first need to talk about what home field advantage is and what it isn’t. Now there may be differing opinions on this but here is mine.
I make the assumption that any HFA unique to a team should not involve any factors that involve the visiting team. So while travel and timezone changes matter, the extent thereof is impacted based on where the visiting team is coming from.
Fans, weather conditions, or even elevation can then be considered part of a team’s unique HFA and won’t be accounted for separately in the model.
I assume the difference in performance of efficiency at home vs on the road, after accounting for these other “environmental” effects to be a team’s home field advantage. I model a teams home field advantage above the average HFA in college football as
The \(g()\) functions are splines with 2 internal knots to account for nonlinear effects of travel and elevation change. Elevation change is included because only if a visiting team doesn’t play at elevation normally is it a factor (recall my rule that things dependent on the visiting team shouldn’t be considered home field advantages above the average).
I use a Bayesian model with weakly informative normal priors (see the default of rstanarm or click the code at the top of the page).
Data
I am missing venues for some of the data, a total of 330 games out of 15618 . A summary of the total missing venues for the each season is shown below.
season
games
2005
49
2006
50
2007
57
2008
35
2009
28
2010
28
2011
33
2012
26
2013
24
Using the latitude and longitude of the game’s stadium and each team’s respective home stadiums I calculate the distance traveled for each team and any effects of elevation. For the purposes of this study I will not adjust capacity differences as that can reasonably be part of the home field effect. I do show the correlation between my estimates and attendance later on.
The estimated average home field advantage for all teams from 2005 to 2023 is 0.11 points per drive for the home team. With an average of 12.5 offensive drives for each team we can estimate the average home field advantage is 2.8 points per game.
While I make estimates for average team ability since 2005 in each season of the dataset and each venue they played at in that timespan, I am only assessing the most recent stadium a team has played in for the following analysis if a team has had more than one home stadium since 2005.
Even with 18 years of data, it is difficult to detect if a team has a stronger home field advantage than another. That being said, 2 of them show evidence of being a weaker home field advantage than the average college stadium and 9 show significant evidence of having a stronger home field advantage than other stadiums.
There are a total of 247 current unique home stadiums between FBS and FCS that I have in my dataset. If I am assessing 247 teams home stadiums in my dataset to see if they have a stronger or weaker home field advantage than the average college football team, if there is no effect I would expect 20 percent of the teams to have a posterior probability greater than 0.80 of being different than the average home field advantage (HFA). That would be about 49 teams. In fact my analysis shows that only 11 teams meet such a threshold. Thus, even the teams we do observe with a home field advantage are likely due to chance.
Despite the inconclusive effects for HFA for most teams, I am able to at least provide an estimate for each team’s home stadium, even if the evidence isn’t that strong. This estimate shows the estimated HFA as points per drive for each home team above that of an average home field advantage.
Estimated Stadium Home Field Advantage (HFA)
Vs. Avg. HFA 2005-2023 Seasons
We see even for Army (the highest effect) once we multiply its posterior mean home effect by the average drives in a game, it comes out to 2.2 points per game which is about double the estimated average home field advantage effect of 2.8 points per game (assuming an average number of drives per game).
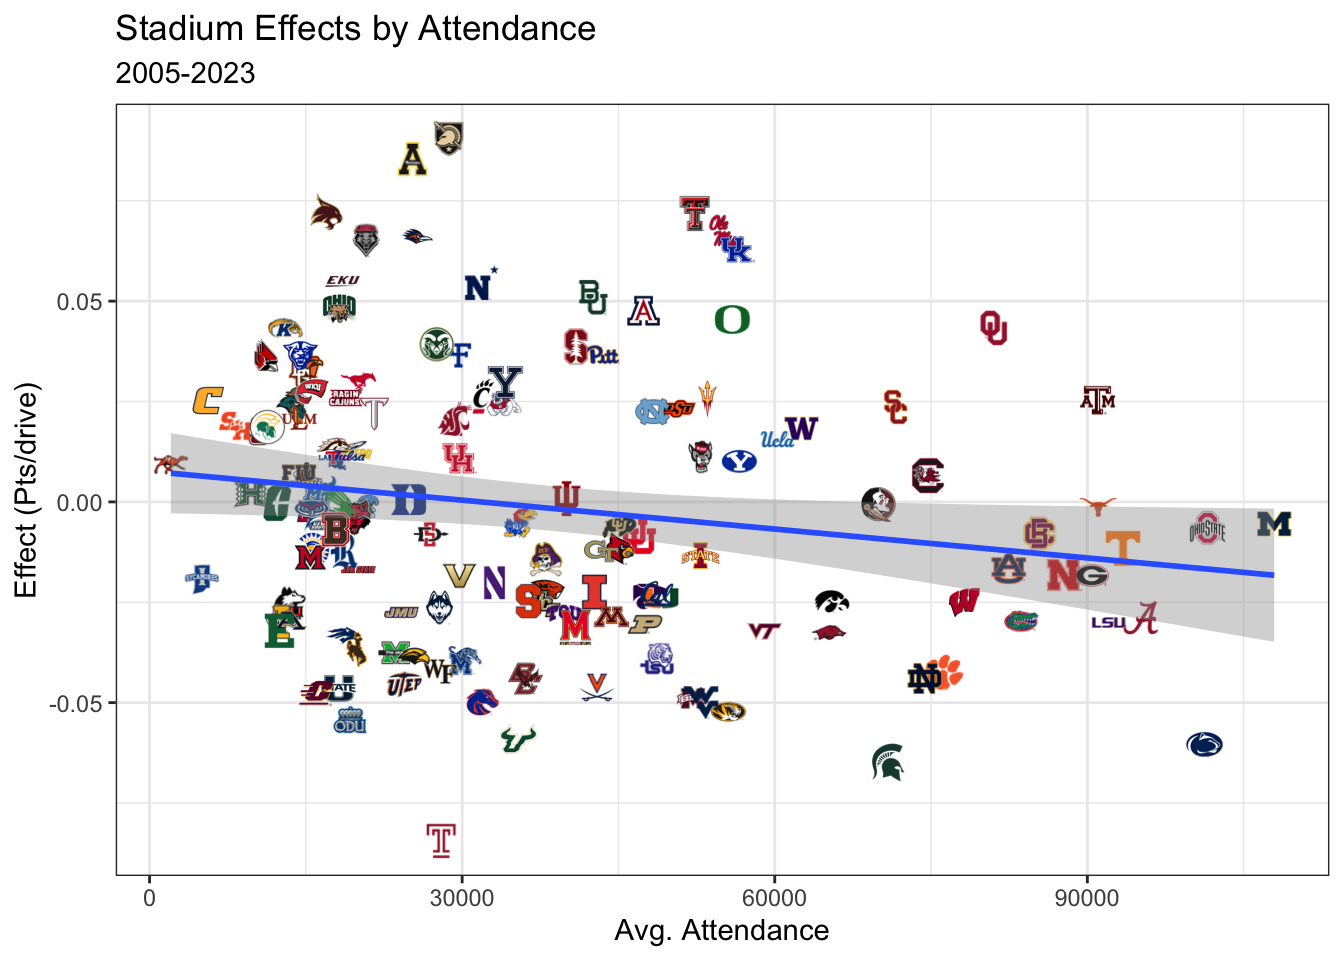
Attendance
One of the factors in the EA Sports rankings was the number of fans in the stands but our model doesn’t show fan attendence as correlated with the stadium specific home field advantage. It even appears that attendence is slightly negatively correlated with the specific home field advantage effects. This goes against intuition as crowd noise is believed to be able to impact penalties like false starts and also referee behavior.
There is an important confounder here which is team ability. Better football schools traditionally have bigger stadiums and fan support. Perhaps teams with better players and by extension more fans also have players that are less likely to be impacted by opposing fans or their own fans.
This also brings up another point which is that this model solely measures how teams play at their home compared to the average home field advantage. For Army this could be for reasons around the strict routine of West Point or its unique offense which lends itself to play better at home than the road that have nothing to do with Michie Stadium. Then again who wouldn’t be affected by military cannons blasting at you and soldiers jumping out of helicopters?
In order to fully disentangle a team’s typical performance on the road against the effect of the stadium they’re playing out, additional effects for a team’s road performance need to be added to estimate this. With already small effects for stadium specific advantages without all those additional parameters, this is unlikely to increase the significance of these effects.
Does This Persist?
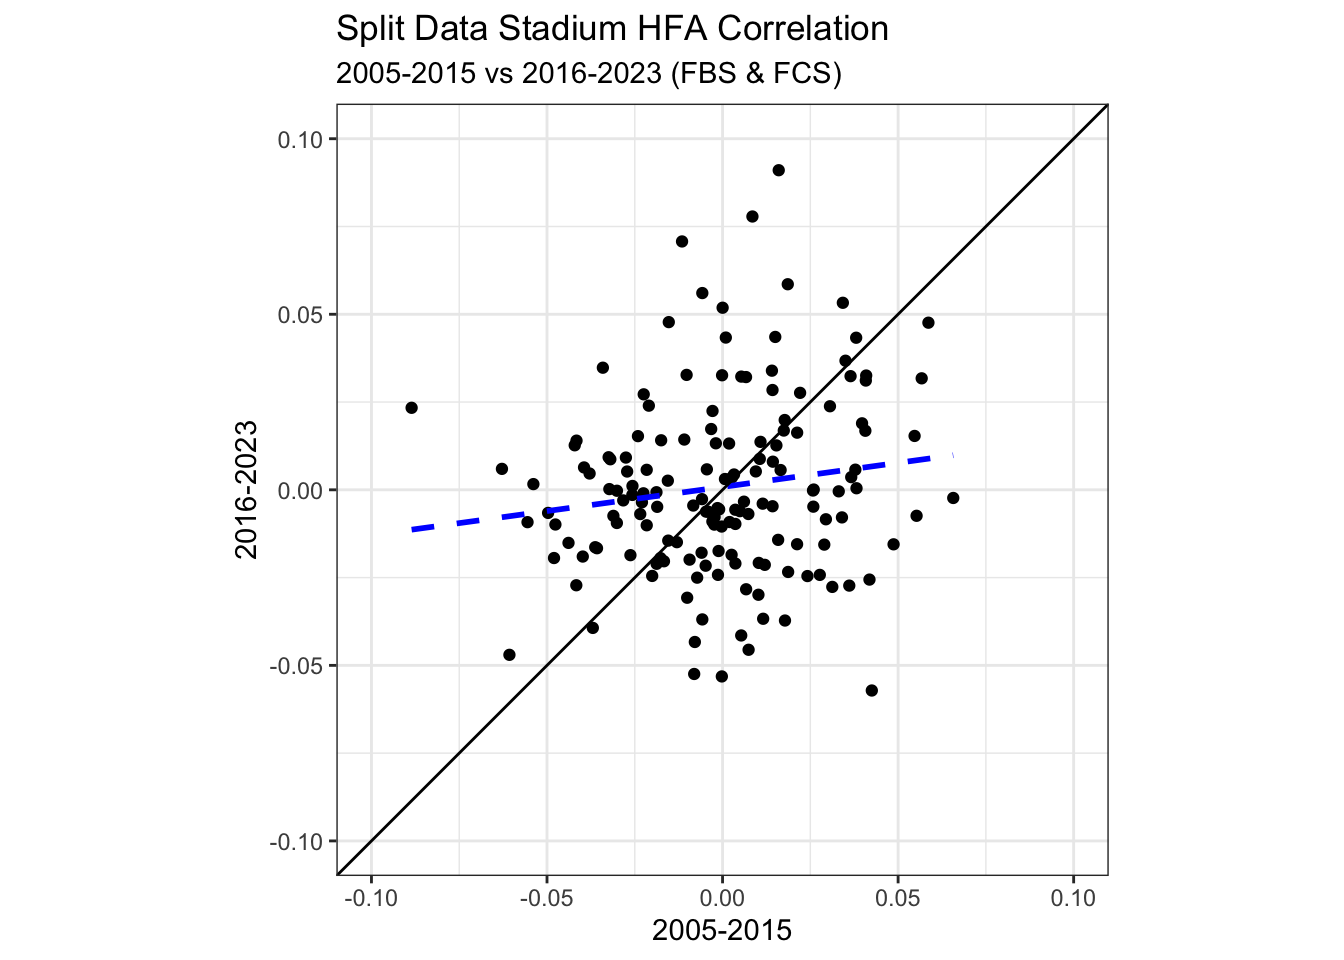
It’s one thing to have a ranking of teams, but if we split our data in half would we get similar results in both datasets? In other words, is this effect real or is it just a ranking because if you model something it will order teams in some way?
I split the data up into two unique groups:
Games between 2005 and 2015
Games between 2016 and 2023
Then I fit the exact same model to both of them to get an estimate of the effect of the venue above the average home field advantage.
The correlation between the two time periods is not zero and in fact is positively correlated with posterior probability of almost 1 but it is still fairly weak at about 0.15.
Split Data Stadium HFA Correlation
2005-2015 vs 2016-2023 (FBS & FCS)
Corr. (Post. Mean)
Corr. (Post. Median)
Num of Stadiums
0.148
0.147
156
We can visualize it graphically as well,
Takeaways
Generally it is very hard to estimate if one team or stadium has a stronger home field advantage than another. That being said, there are a handful of teams that may have enough evidence of a stronger homefield advantage than what you would think. These teams are not the typical powerhouse teams with large crowds. The reasoning behind why these teams may have a larger HFA is solely conjecture at this point and the distribution of all posterior mean stadium effects falls roughly inline with the expected distribution of HFA effects observable by noise if no stadium had a larger HFA than another.
Beyond this study, a more interesting question perhaps is if there is a statistically significant effect on false start rates by stadium beyond what you would expect with multiple testing. If that is the case that is evidence of a home field advantage beyond average, but the effect size might be small enough to not make an impact in an analysis like this one.
This would be akin to my analysis on home crowds affecting college basketball free throw shooting in a previous post.
Source Code
---title: "Who has the Biggest Home-Field Advantage? It's Not Who You Think."date: 2024-07-09author: "Paul Sabin"description: "Why EA Sports new college football game's home field advantage rankings are not backed by data."categories: - college football - home field advantage - football - sports analytics - EPAimage: "images/ea_top10_toughest.png"twitter-card: image: "images/ea_top10_toughest.png"open-graph: image: "images/ea_top10_toughest.png"format: html: code-fold: true code-summary: "Show the code"editor: visualexecute: echo: false warning: false error: false message: false cache: false---```{r}library(tidyverse)library(cfbfastR)library(lubridate)library(splines)library(rstanarm)library(broom.mixed)library(rstan)library(rstanarm)library(kableExtra)library(viridis)library(tidybayes)library(gtExtras)library(ggimage)source("r/get_gamma_parameters.R")source("r/haversine_distance.R")source("r/get_utc_offset.R")options(tibble.width =Inf)options(mc.cores = parallel::detectCores())options(scipen=999)current_year <-2024historical_seasons <-20run_historical <- TRUE#whether or not to run values for past seasons: if TRUE then just this seasonrun_weekly_historical <- FALSE#whether or not to go through week by week in season instead of just end of season resultsrun_multiseason <- FALSE#whether to run the model on multiple seasons at once (will use the week cutoffs as designated by run_weekly_historical)use_full_priors <- TRUE#if we use full prior models, if not we just use the 247 team talent values``````{r}# CFB Talent from 247 (Adjusted) ------------------------------------------#for rough prior value talent numberscfb_teams <-cfbd_team_info(only_fbs =FALSE)cfb_247_talent <-cfbd_team_talent() %>%mutate(talent =ifelse(talent ==0, NA_real_, talent)) %>%distinct()#join on fbs/fcs schools to make sure no one is missingcfb_247_talent <- cfb_teams %>%filter(classification %in%c("fbs", "fcs")) %>%pull(school) %>%expand_grid(team = ., season =unique(cfb_247_talent$year)) %>%left_join(., cfb_247_talent,by =c("season"="year", "team"="school")) %>%left_join(cfb_teams %>% dplyr::select(team = school, team_division = classification, team_conference = conference),by =c("team")) %>%mutate(season_team =paste(season, team, sep ='_') ) %>%arrange(team, season) %>%group_by(season, team_conference) %>%mutate(conf_average_talent =mean(talent, na.rm =TRUE)) %>%group_by(team) %>%mutate(team_average_talent =mean(talent, na.rm =TRUE),team_last_talent =lag(talent)) %>%ungroup() %>%### replace missing talent values with an average of the conference average, the teams last value and teams averagemutate(non_missing_values =0+ (!is.na(conf_average_talent)) + (!is.na(team_average_talent)) + (!is.na(team_last_talent)),missing_replacement = (replace_na(conf_average_talent, 0) +replace_na(team_average_talent,0) +replace_na(team_last_talent, 0)) / non_missing_values,talent =coalesce(talent, missing_replacement) )## if missing "team_division" then give it 'fcs'cfb_247_talent <- cfb_247_talent %>%mutate(team_division =coalesce(team_division, 'fcs'))## if still missing values, take the minimum for their division (fbs or fcs)cfb_247_talent <- cfb_247_talent %>%group_by(season, team_division) %>%mutate(talent =coalesce(talent, min(talent, na.rm =TRUE))) %>%ungroup()#now add in the log talent vs fbs z-scorecfb_247_talent <- cfb_247_talent %>%group_by(season) %>%mutate(talent_vs_fbs_avg = talent -mean(talent[team_division =='fbs'],na.rm =TRUE),talent_vs_fbs_avg_z = talent_vs_fbs_avg /sd(talent_vs_fbs_avg[team_division =='fbs'], na.rm =TRUE),log_talent =log(talent),avg_fbs_log_talent =mean(log_talent[team_division =='fbs'], na.rm =TRUE),log_talent_vs_fbs_avg = log_talent - avg_fbs_log_talent,log_talent_vs_fbs_z = log_talent_vs_fbs_avg/sd(log_talent_vs_fbs_avg) ) %>%ungroup()# Add in Priors Based on Team Talent --------------------# Read in Drives & PBP Data -----------------------------------------------drives_data <- games_data <- advanced_games_data <-NULLfor(s in (current_year - historical_seasons +1):current_year){ drives_data <- cfbfastR::cfbd_drives(year = s) %>%bind_rows(drives_data, .) games_data <- cfbfastR::cfbd_game_info(year = s) %>%mutate(start_date =ymd_hms(start_date)) %>%bind_rows(games_data, .) advanced_games_data <- cfbfastR::cfbd_stats_game_advanced(s) %>%bind_rows(advanced_games_data, .)# cat("finished loading data from season ", s, "\r")}### use drive data to get a net points per play in a game substitutegames_summary_from_drives <- drives_data |>group_by(game_id, offense, offense_conference, defense, defense_conference, is_home_offense ) |>summarize(pts_scored =sum(end_offense_score - start_offense_score),pts_allowed =sum(end_defense_score - start_defense_score),tot_off_yards =sum(yards),tot_plays =sum(plays) )advanced_games_data_simple <- advanced_games_data |>left_join(games_data, by =c("game_id", "week") ) |>filter(off_ppa !=0, !is.na(off_ppa)) |>filter(!is.na(season)) |> dplyr::select(season, season_type,game_date = start_date, game_id, week, team, opponent, completed, neutral_site, venue_id, venue, home_id, home_team, home_division, home_points, away_id, away_team, away_division, away_points, off_plays:off_drives, off_ppa, off_total_ppa, def_plays, def_drives, def_ppa, def_total_ppa, )epa_wpa_game_summary <- advanced_games_data_simple %>%rename(tot_epa = off_total_ppa,epa_play = off_ppa,drives = off_drives,plays = off_plays) |>ungroup() %>%mutate(epa_drive = tot_epa / drives)##only have games where there is at least 1 fbs and fcs teamepa_wpa_game_summary <- epa_wpa_game_summary %>%filter(home_division %in%c("fbs", "fcs") | away_division %in%c("fbs", "fcs")) %>%filter(!(is.na(home_division) &is.na(away_division)) )#get rid of games where team division is unknown for both teams#calculate attendance for both teamsavg_stadium_attendance <- games_data |>filter(!is.na(attendance), attendance >0) |>group_by(venue_id) |>summarize(avg_attendance =mean(attendance))``````{r}# Data Wrangling for Games Data -------------------------------------------venues <-cfbd_venues() %>%unnest(location) %>%rename(latitude = x, longitude = y)teams <-cfbd_team_info(only_fbs =FALSE) %>%filter(classification %in%c("fcs", "fbs"))#Sam Houston State & Jacksonville State are now FBS but not reflected hereteams <- teams %>%mutate(classification =ifelse(school %in%c("Sam Houston State", "Jacksonville State"),'fbs', classification) )#make sure everything we need with respect to each team is presentgames_data_full <- epa_wpa_game_summary |>mutate(team_points =ifelse(team == home_team, home_points, away_points),opp_points =ifelse(opponent == home_team, home_points, away_points),home_ind =ifelse(team == home_team, 1, 0),team_id =ifelse(home_ind ==1, home_id, away_id),opp_id =ifelse(home_ind ==0, home_id, away_id),#add -1,0,1 away/neutral/home indicator & WIN/LOSS indicatorhome_effect =case_when(neutral_site ~0, home_ind ==1~1, TRUE~-1),team_wl =ifelse(team_points > opp_points, 1, 0),team_net_points = team_points - opp_points )### calculate distance traveled, elevation effects, days rest, capacity changesgames_data_full <- games_data_full %>%left_join(teams %>% dplyr::select(team_id = team_id,team_logo = logo,team_timezone = timezone,team_latitude = latitude,team_longitude = longitude,team_elevation = elevation,team_capacity = capacity),by =c("team_id")) %>%left_join(teams %>% dplyr::select(opp_id = team_id,opp_logo = logo,opp_timezone = timezone,opp_latitude = latitude,opp_longitude = longitude,opp_elevation = elevation,opp_capacity = capacity),by =c("opp_id")) %>%left_join(venues %>% dplyr::select(venue_id,venue_capacity = capacity,venue_dome = dome,venue_timezone = timezone,venue_elevation = elevation,venue_latitude = latitude,venue_longitude = longitude),by =c("venue_id")) %>%mutate_at(vars(contains("elevation")), as.numeric) %>%mutate(venue_elevation = venue_elevation*3.28084,#convert from meters to feetteam_elevation = team_elevation*3.28084,#convert from meters to feetopp_elevation = opp_elevation*3.28084,#convert from meters to feetteam_miles_traveled =haversine_distance(lat1 = team_latitude, lon1 = team_longitude, lat2 = venue_latitude, lon2 = venue_longitude),opp_miles_traveled =haversine_distance(lat1 = opp_latitude, lon1 = opp_longitude, lat2 = venue_latitude, lon2 = venue_longitude),team_timezone_integer =get_utc_offset(game_date, team_timezone),opp_timezone_integer =get_utc_offset(game_date, opp_timezone),venue_timezone_integer =get_utc_offset(game_date, coalesce(venue_timezone, "America/New_York")),#assume eastern time if venue is missing#timezone travelteam_timezone_change = venue_timezone_integer - team_timezone_integer,opp_timezone_change = venue_timezone_integer - opp_timezone_integer,#capacity changeteam_capacity_change = venue_capacity - team_capacity,opp_capacity_change = venue_capacity - opp_capacity,#elevation changeteam_elevation_change = venue_elevation - team_elevation,opp_elevation_change = venue_elevation - opp_elevation,#calculate if away team is at elevation disadvantageopp_elevation_effect = (opp_elevation_change >3000) - (team_elevation_change >3000),team_elevation_effect =-opp_elevation_effect,#only effect is if you're at advantage because your opponent is dealing with elevation#calculate if away team is playing in front of very different crowd than usualopp_capacity_effect = (opp_capacity_change - team_capacity_change),team_capacity_effect =-opp_capacity_effect,#away distance traveled effectopp_distance_effect = (opp_miles_traveled - team_miles_traveled),team_distance_effect =-opp_distance_effect,#away timezone effectopp_timezone_effect = (opp_timezone_change - team_timezone_change),team_timezone_effect =-opp_timezone_effect )## after duplication of rows, get days rest for each team and then comparegames_data_full <- games_data_full %>%arrange(season, game_date, week) %>%group_by(season, team) %>%mutate(team_days_rest =difftime(game_date, lag(game_date), unit ='days') %>%as.numeric() %>%coalesce(., 7)) %>%group_by(season, opponent) %>%mutate(opp_days_rest =difftime(game_date, lag(game_date), unit ='days') %>%as.numeric() %>%coalesce(., 7)) %>%ungroup() %>%mutate(team_days_rest_effect = team_days_rest - opp_days_rest,opp_days_rest_effect =-team_days_rest_effect, )## calculate team/season effect (teams with less than 5 games grouped toegether)games_data_full <- games_data_full |>group_by(team_id) |>mutate(n_team_games =n(),temp_team_id =ifelse(n_team_games <=5, -1, team_id) ) |>group_by(opp_id) |>mutate(n_opp_games =n(),temp_opp_id =ifelse(n_opp_games <=5, -1, opp_id) ) |>ungroup() |>mutate(team_season_id =paste0(season, "-", temp_team_id),opp_season_id =paste0(season, "-", temp_opp_id), )#timezone changes max out at 3 games_data_full <- games_data_full |>mutate(team_timezone_change =case_when(team_timezone_change >3~3, team_timezone_change <-3~-3,TRUE~ team_timezone_change) )```# EA Sports Hardest Places to PlayCollege Football fans (including me) cannot wait for the new College Football 25 video game to come out. As part of the game there are team rankings provided by EA sports in addition to rankings of the [25 hardest places to play](https://www.ea.com/games/ea-sports-college-football/college-football-25/news/college-football-25-rankings-week-showcase).The top of the hardes places list is a who's who of college football. EA Sports mentions the rankings of the toughest places to play come from a combination of "home winning %, home game attendance, active home winning streaks, team prestige, and more."The top 10 venues listed by EA Sports are also in the top 20 in total capacity across College Football. Clearly stadium capacity is correlated in EA's mind with being a tough place to play.# Good Teams - All They Do Is Win```{r}#| eval: falsegames_data_full |>filter(team =="Alabama", season >=2007) |>group_by(home_effect) |>summarize(wins =sum(team_wl),losses =sum(team_wl ==0),win_pct =sum(team_wl) /n() )games_data_full |>filter(season >=2007) |>group_by(home_effect, team) |>summarize(wins =sum(team_wl),losses =sum(team_wl ==0),win_pct =sum(team_wl) /n(),.groups ="drop" ) |>filter(home_effect ==1) |>arrange(desc(win_pct))```Can we disentengle home team ability from a home field advantage? Alabama's winning percentage at home in the Nick Saban era (2007-2023) was 93% which is the highest of any FBS team in that timespan.So is Bryant-Denney Stadium a particularly hard place to play? In short of course it is. Just look at how rarely Alabama has lost there. But there's no evidence that it is any more difficult of a place to play than the average college football home venue *after adjusting for the home team*. Don't believe me? Well in 21 neutral site games over that same time Alabama had a 95% winning percentage and even had a 84% winning percentage on the road. So while 84% on the road is worse, Alabama's road schedule is almost exclusively against SEC teams while they typically have one or two non-power conference (including FCS) home games each year.While they do boast a raucous crowd and it can be very hot and humid in Tuscaloosa, but the most difficult thing about winning there is the players wearing crimson on the field, not the stadium or the crowd.### Home vs RoadTheoretically, all else being equal, teams that have a bigger home field advantage should have a bigger difference of performance at home vs on the road. That could be in winning percentage or in efficiency (points or EPA per play or drive). The problem is, in college football, nothing is equal between teams or between road and home schedules. Let's look at winning percentage the last 19 seasons on the road versus at home.```{r}home_vs_road_winpct_plot <- games_data_full |>left_join(cfb_teams, by ="team_id") |>filter(classification =='fbs') |>group_by(team, logo, home_effect) |>summarize(wins =sum(team_wl),losses =sum(team_wl ==0),games =n(),win_pct =sum(team_wl) /n(),.groups ="drop" ) |>filter(home_effect !=0) |>mutate(home_road =ifelse(home_effect ==-1, "road", "home")) |> dplyr::select(-home_effect,-wins,-losses) |>pivot_wider(values_from =c("win_pct", "games"),names_from ="home_road") |>filter(games_road >=20, games_home >=20) |>ggplot(aes(x = win_pct_road, y = win_pct_home)) +geom_image(aes(image = logo)) +geom_smooth(method ='glm', col ='blue', se =FALSE,linetype =2,linewidth =0.5) +geom_abline(intercept =0, slope =1) +theme_bw() +xlim(0,1) +ylim(0,1) +xlab("Road") +ylab("Home") +theme(aspect.ratio =1) +ggtitle("Home vs Road Win Pct", subtitle ="2005-2023 (No Neutral Site Games)")home_vs_road_winpct_plot```If everything else was equal, teams with bigger HFA would be further away to the top and left of the dotted blue line and teams with smaller HFA would be below the dotted blue line. The black line represents an equal winning percentage on the road and at home. There isn't a school in this time span with a worse home winning percentage than road winning percentage.#### What is Home Field Advantage?Home field advantage is well studied and documented. But do some teams have a larger home field advantage than others? In order to answer that we first need to talk about what home field advantage is and what it isn't. Now there may be differing opinions on this but here is mine.I make the assumption that any HFA unique to a team should not involve any factors that involve the visiting team. So while travel and timezone changes matter, the extent thereof is impacted based on where the visiting team is coming from.Fans, weather conditions, or even elevation can then be considered part of a team's unique HFA and won't be accounted for separately in the model.I assume the difference in performance of efficiency at home vs on the road, after accounting for these other "environmental" effects to be a team's home field advantage. I model a teams home field advantage **above the average HFA** in college football as```{=tex}\begin{align*}\text{Off EPA per drive} &= \beta_0\\& + \text{HFA}\beta_1\\& + \gamma_{venue}\\& + \gamma_{team-offense}\\& + \gamma_{team-defense}\\& + \gamma_{team-timezone-change}\\& + \text{off days rest}\beta_2\\& + g_1(\text{off travel distance})\\& + g_2(\text{def travel distance})\\& + g_3(\text{off elevation change})\end{align*}```The $g()$ functions are splines with 2 internal knots to account for nonlinear effects of travel and elevation change. Elevation change is included because only if a visiting team doesn't play at elevation normally is it a factor (recall my rule that things dependent on the visiting team shouldn't be considered home field advantages above the average).I use a Bayesian model with weakly informative normal priors (see the default of *rstanarm* or click the code at the top of the page).## DataI am missing venues for some of the data, a total of `r nrow(filter(epa_wpa_game_summary, is.na(venue_id)))/2` games out of `r nrow(epa_wpa_game_summary)/2` . A summary of the total missing venues for the each season is shown below.```{r}epa_wpa_game_summary |>filter(is.na(venue_id)) |>count(season) |>mutate(games = n/2) |>select(-n) |>kable() |> kableExtra::kable_classic_2()```Using the latitude and longitude of the game's stadium and each team's respective home stadiums I calculate the distance traveled for each team and any effects of elevation. For the purposes of this study I will not adjust capacity differences as that can reasonably be part of the home field effect. I do show the correlation between my estimates and attendance later on.```{r}## stan model treating teams across seasons as the same.# unique_hfa_mod <- stan_lmer(epa_drive ~ home_effect + # (1|team_season_id) + (1|opp_season_id) +# home_effect:(1|venue_id) + # bs(team_miles_traveled, df = 3) + # bs(opp_miles_traveled, df = 3) + # (1|team_timezone_change) + # bs(team_elevation_change, knots = c(2000,4000)) + # team_days_rest_effect, # data = games_data_full,# iter = 1200,# warmup = 800)# unique_hfa_mod |> write_rds("cfb_hfa_mod.rds")unique_hfa_mod<-read_rds("stan/cfb_hfa_mod.rds")mod_summary <-summary(unique_hfa_mod)mod_summary_tbl <- mod_summary |>as_tibble() |>mutate(coef =row.names(mod_summary))#overall hfaavg_hfa <- mod_summary_tbl |>filter(str_detect(coef, "home_effect"))#venuesvenue_summary_tbl <- mod_summary_tbl |>filter(str_detect(coef, "venue")) |>mutate(venue_id =str_extract(coef, "[[:digit:]]+") |>as.integer()) |>left_join(venues, by ="venue_id")#team offenses & defensesteam_values_long <- mod_summary_tbl |>filter(str_detect(coef, "team_season_id")) |>mutate(team_season_id =str_extract(coef, "[[:digit:]]+\\-[[:digit:]]+"),season =str_remove(team_season_id, "\\-[[:digit:]]+") |>as.integer(),team_id =str_remove(team_season_id, "[[:digit:]]+\\-") |>as.integer() ) |> dplyr::select(-coef, -team_season_id) |>pivot_longer(cols = mean:Rhat, names_to ="variable", values_to ="off_value") |>left_join(mod_summary_tbl |>filter(str_detect(coef, "opp_season_id")) |>mutate(team_season_id =str_extract(coef, "[[:digit:]]+\\-[[:digit:]]+"),season =str_remove(team_season_id, "\\-[[:digit:]]+") |>as.integer(),team_id =str_remove(team_season_id, "[[:digit:]]+\\-") |>as.integer() ) |> dplyr::select(-coef, -team_season_id) |>pivot_longer(cols = mean:Rhat, names_to ="variable", values_to ="def_value"),by =c("team_id", "variable", "season"))team_effects_per_drive <- team_values_long |>filter(variable =="mean") |>mutate(def_value =-def_value,team_value = off_value + def_value,team_per_game = team_value *mean(advanced_games_data$off_drives)) |>left_join(cfb_teams, by ="team_id") |>arrange(desc(team_per_game)) |>left_join(venue_summary_tbl |> dplyr::select(stadium_pts_per_drive = mean,stadium_pts_q10 =`10%`,stadium_pts_q90 =`90%`, venue_id,stadium_name = name) |>mutate(stadium_post_prob_abv_80 =sign(stadium_pts_q10) ==sign(stadium_pts_q90)),by ="venue_id")#ignore if no stadium effectteam_effects_per_drive <- team_effects_per_drive |>filter(!is.na(stadium_pts_per_drive))# View(team_effects_per_drive)## only look at stadium by current teamstadium_effects_per_drive <- team_effects_per_drive |> dplyr::select(team_id, school:last_col()) |>distinct()# View(stadium_effects_per_drive)avg_drive_game <-mean(games_data_full$drives)#per team#so hfa has to account for both team's drives (2 x the number above)```The estimated average home field advantage for all teams from 2005 to 2023 is `r round(avg_hfa$mean, digits = 2)` points per drive for the home team. With an average of `r round(avg_drive_game, digits = 1)` offensive drives for each team we can estimate the average home field advantage is `r round(avg_hfa$mean*avg_drive_game*2, digits = 1)` points per game.While I make estimates for average team ability since 2005 in each season of the dataset and each venue they played at in that timespan, I am only assessing the most recent stadium a team has played in for the following analysis if a team has had more than one home stadium since 2005.Even with 18 years of data, it is difficult to detect if a team has a stronger home field advantage than another. That being said, `r sum(stadium_effects_per_drive$stadium_post_prob_abv_80 & stadium_effects_per_drive$stadium_pts_per_drive < 0, na.rm = TRUE)` of them show evidence of being a weaker home field advantage than the average college stadium and `r sum(stadium_effects_per_drive$stadium_post_prob_abv_80 & stadium_effects_per_drive$stadium_pts_per_drive > 0, na.rm = TRUE)` show significant evidence of having a stronger home field advantage than other stadiums.There are a total of `r nrow(stadium_effects_per_drive)` current unique home stadiums between FBS and FCS that I have in my dataset. If I am assessing 247 teams home stadiums in my dataset to see if they have a stronger or weaker home field advantage than the average college football team, if there is no effect I would expect 20 percent of the teams to have a posterior probability greater than 0.80 of being different than the average home field advantage (HFA). That would be about 49 teams. In fact my analysis shows that only `r sum(stadium_effects_per_drive$stadium_post_prob_abv_80 != 0, na.rm = TRUE)` teams meet such a threshold. Thus, even the teams we do observe with a home field advantage are likely due to chance.Despite the inconclusive effects for HFA for most teams, I am able to at least provide *an estimate* for each team's home stadium, even if the evidence isn't that strong. This estimate shows the estimated HFA as points *per drive* for each home team above that of an average home field advantage.```{r}stadium_effects_hfa_gt <- stadium_effects_per_drive |>mutate(stadium_pts_per_game =2*stadium_pts_per_drive*avg_drive_game,stadium_post_interval =paste0("(", round(stadium_pts_q10, digits =2), ", ", round(stadium_pts_q90, digits =2), ")" ) ) |> dplyr::select(stadium_name, stadium_pts_per_game, stadium_pts_per_drive, stadium_post_interval, school, logo, capacity, city, state, conference, classification ) |>arrange(desc(stadium_pts_per_drive)) |>gt() %>%cols_label(stadium_name ="Stadium",stadium_pts_per_game ="HFA (per Game)",stadium_pts_per_drive ="HFA (per Drive)",stadium_post_interval ="HFA (80% Posterior Interval)",school ="School",logo ="",capacity ="Capacity",city ="City",state ="St.",conference ="Conf.",classification ="Subdivision" ) %>%# # text_transform(# # locations = cells_body(c("fbref_logo_url")),# # fn = function(x) {# # map(x, ~ web_image(.x))# # }# # ) %>% # tab_style(# style = cell_text(weight = "bold"),# locations = cells_column_labels()# ) %>%cols_align(align =c("center"),columns =everything() ) %>%# fmt_percent(columns = ftp_first:ftp_diff,# decimals = 0) %>%fmt_number(columns = stadium_pts_per_game,decimals =1) |>fmt_number(columns = stadium_pts_per_drive,decimals =2) %>%fmt_number(columns = capacity,sep_mark =",",decimals =0) %>%gt_img_rows(columns = logo, img_source ="web", height =30) %>%tab_header(title ="Estimated Stadium Home Field Advantage (HFA)",subtitle ="Vs. Avg. HFA 2005-2023 Seasons" ) %>%# gt_theme_538() %>%data_color(columns =c(stadium_pts_per_drive, capacity),colors = scales::col_numeric(palette =viridis(10),domain =NULL) # You can adjust the number of colors as needed ) %>%opt_interactive()stadium_effects_hfa_gt```We see even for Army (the highest effect) once we multiply its posterior mean home effect by the average drives in a game, it comes out to 2.2 points per game which is about double the estimated average home field advantage effect of `r round(avg_drive_game*avg_hfa$mean*2, digits = 1)` points per game (assuming an average number of drives per game).## AttendanceOne of the factors in the EA Sports rankings was the number of fans in the stands but our model doesn't show fan attendence as correlated with the stadium specific home field advantage. It even appears that attendence is slightly negatively correlated with the specific home field advantage effects. This goes against intuition as crowd noise is believed to be able to impact penalties like false starts and also referee behavior.```{r}attendance_effect_plot <- stadium_effects_per_drive |>left_join(avg_stadium_attendance , by ="venue_id") |>filter(!is.na(avg_attendance)) |>ggplot(aes(x = avg_attendance, y = stadium_pts_per_drive) ) +geom_image(aes(image = logo)) +geom_smooth(method ='glm') +xlab("Avg. Attendance") +ylab("Effect (Pts/drive)") +theme_bw() +ggtitle("Stadium Effects by Attendance", subtitle ="2005-2023")attendance_effect_plot```There is an important confounder here which is team ability. Better football schools traditionally have bigger stadiums and fan support. Perhaps teams with better players and by extension more fans also have players that are less likely to be impacted by opposing fans or their own fans.This also brings up another point which is that this model solely measures how teams *play* at their home compared to the average home field advantage. For Army this could be for reasons around the strict routine of West Point or its unique offense which lends itself to play better at home than the road that have nothing to do with Michie Stadium. Then again who wouldn't be affected by military cannons blasting at you and soldiers jumping out of helicopters?In order to fully disentangle a team's typical performance on the road against the effect of the stadium they're playing out, additional effects for a team's **road** performance need to be added to estimate this. With already small effects for stadium specific advantages without all those additional parameters, this is unlikely to increase the significance of these effects.# Does This Persist?It's one thing to have a ranking of teams, but if we split our data in half would we get similar results in both datasets? In other words, is this effect real or is it just a ranking because if you model something it will order teams in **some** way?I split the data up into two unique groups:- Games between 2005 and 2015- Games between 2016 and 2023Then I fit the exact same model to both of them to get an estimate of the effect of the venue **above the average home field advantage**.```{r}## stan model treating teams across seasons as the same.#split model in to 2005-2015 and 2016-2023games_data_first_half <- games_data_full |>filter(season <=2015)games_data_second_half <- games_data_full |>filter(season >2015)# # unique_hfa_mod_first_half <- stan_lmer(epa_drive ~ home_effect +# (1|team_season_id) + (1|opp_season_id) +# home_effect:(1|venue_id) +# bs(team_miles_traveled, df = 3) +# bs(opp_miles_traveled, df = 3) +# (1|team_timezone_change) +# bs(team_elevation_change, knots = c(2000,4000)) +# team_days_rest_effect,# data = games_data_first_half,# iter = 1200,# warmup = 800)# # unique_hfa_mod_second_half <- stan_lmer(epa_drive ~ home_effect +# (1|team_season_id) + (1|opp_season_id) +# home_effect:(1|venue_id) +# bs(team_miles_traveled, df = 3) +# bs(opp_miles_traveled, df = 3) +# (1|team_timezone_change) +# bs(team_elevation_change, knots = c(2000,4000)) +# team_days_rest_effect,# data = games_data_second_half,# iter = 1200,# warmup = 800)# unique_hfa_mod_first_half |> write_rds("stan/unique_hfa_mod_first_half.rds")unique_hfa_mod_first_half<-read_rds("stan/unique_hfa_mod_first_half.rds")# unique_hfa_mod_second_half |> write_rds("stan/unique_hfa_mod_second_half.rds")unique_hfa_mod_second_half<-read_rds("stan/unique_hfa_mod_second_half.rds")``````{r}mod_summary_first_half <-summary(unique_hfa_mod_first_half)mod_summary_tbl_first_half <- mod_summary_first_half |>as_tibble() |>mutate(coef =row.names(mod_summary_first_half))mod_summary_second_half <-summary(unique_hfa_mod_second_half)mod_summary_tbl_second_half <- mod_summary_second_half |>as_tibble() |>mutate(coef =row.names(mod_summary_second_half))#overall hfaavg_hfa_split_data <- mod_summary_tbl_first_half |>filter(str_detect(coef, "home_effect")) |>mutate(half_of_data ="first") |>bind_rows(mod_summary_tbl_second_half |>filter(str_detect(coef, "home_effect")) |>mutate(half_of_data ="second") )#venuesvenue_summary_tbl_both_halves <- mod_summary_tbl_first_half |>filter(str_detect(coef, "venue")) |>mutate(venue_id =str_extract(coef, "[[:digit:]]+") |>as.integer()) |> dplyr::select(-coef) |>rename_at(vars(mean:Rhat),~paste0("h1_", .x)) |>left_join(mod_summary_tbl_second_half |>filter(str_detect(coef, "venue")) |>mutate(venue_id =str_extract(coef, "[[:digit:]]+") |>as.integer()) |> dplyr::select(-coef) |>rename_at(vars(mean:Rhat),~paste0("h2_", .x)),by ="venue_id" ) |>left_join(venues, by ="venue_id") ## estimate 1st half of data to 2nd half of data correlation and plot itvenue_data_split_correlation <- venue_summary_tbl_both_halves |>filter(!is.na(h1_mean), !is.na(h2_mean)) |>summarize(mean_cor =cor(h1_mean, h2_mean),med_cor =cor(`h1_50%`, `h2_50%`),venues =n() )```The correlation between the two time periods is not zero and in fact is positively correlated with posterior probability of almost 1 but it is still fairly weak at about 0.15.```{r}venue_data_split_correlation_gt <- venue_data_split_correlation |>gt() %>%cols_label(mean_cor ="Corr. (Post. Mean)", med_cor ="Corr. (Post. Median)",venues ="Num of Stadiums" ) |>cols_align(align =c("center"),columns =everything() ) %>%fmt_number(columns = mean_cor:med_cor,decimals =3) %>%tab_header(title ="Split Data Stadium HFA Correlation",subtitle ="2005-2015 vs 2016-2023 (FBS & FCS)" ) venue_data_split_correlation_gt```We can visualize it graphically as well,```{r}venue_summary_tbl_both_halves_plot <- venue_summary_tbl_both_halves |>filter(!is.na(h1_mean), !is.na(h2_mean)) |>ggplot(aes(x = h1_mean, y = h2_mean)) +geom_point() +geom_smooth(color ='blue', linetype =2, method ='glm', se =FALSE) +geom_abline(intercept =0, slope =1, color='black') +xlab("2005-2015") +ylab("2016-2023") +xlim(-0.1, 0.1) +ylim(-0.1, 0.1) +theme_bw() +theme(aspect.ratio =1) +ggtitle("Split Data Stadium HFA Correlation",subtitle ="2005-2015 vs 2016-2023 (FBS & FCS)")venue_summary_tbl_both_halves_plot```# TakeawaysGenerally it is very hard to estimate if one team or stadium has a stronger home field advantage than another. That being said, there are a handful of teams that may have enough evidence of a stronger homefield advantage than what you would think. These teams are not the typical powerhouse teams with large crowds. The reasoning behind why these teams may have a larger HFA is solely conjecture at this point and the distribution of all posterior mean stadium effects falls roughly inline with the expected distribution of HFA effects observable by noise if no stadium had a larger HFA than another.Beyond this study, a more interesting question perhaps is if there is a statistically significant effect on false start rates by stadium beyond what you would expect with multiple testing. If that is the case that is evidence of a home field advantage beyond average, but the effect size might be small enough to not make an impact in an analysis like this one.This would be akin to my analysis on home crowds affecting college basketball free throw shooting [in a previous post.](https://sabinanalytics.com/blog/2024/02:28:do-college-crowds-affect-free-throws/)